_image0f8.webp)
Every fall, the shopping list resets. Lunchbox snacks, juice boxes, breakfast foods, paper goods, and classroom wipes all move back to the top of the cart, and in 2026, they are landing there at noticeably higher prices. Federal pricing data show that many of these everyday staples cost far more than they did before the pandemic, even as overall inflation has cooled. DOSS paired U.S. Bureau of Labor Statistics pricing data with a survey of 811 parents of K-12 children and 205 K-12 teachers to see how the squeeze is playing out at home and in the classroom.
Key Takeaways
- A fixed basket of everyday lunchbox staples costs American families nearly 45% more than it did in 2019, rising from $21.57 to $31.38.
- Nearly 2 in 3 parents (64%) have switched at least one of their child's favorite brands to a cheaper store-brand alternative this school year.
- Nearly half of parents (45%) have stopped buying a snack, drink, or lunch item their child regularly asks for because it got too expensive.
- Over 1 in 3 parents (36%) say their child has complained after they traded down from a favorite brand to a cheaper one.
- Orange juice costs nearly double what it did in 2019 (+96%), the steepest jump among common lunchbox items.
- Nearly 2 in 3 teachers (64%) have left a classroom essential unstocked this year because they couldn't afford to replace it.
- More than half of teachers (56%) have gone without buying something for themselves to pay for classroom supplies or food for students.
- Parents expect to spend a median of about $200 a month on everyday school-year consumables, and nearly 3 in 4 (71%) say that is more than last year.
How Much More Back-to-School Basics Cost in 2026
The price tags tell the story before the survey even starts. Across nearly every category families rely on for the school year, prices remain well above where they stood in 2019, the last back-to-school season priced before the pandemic.
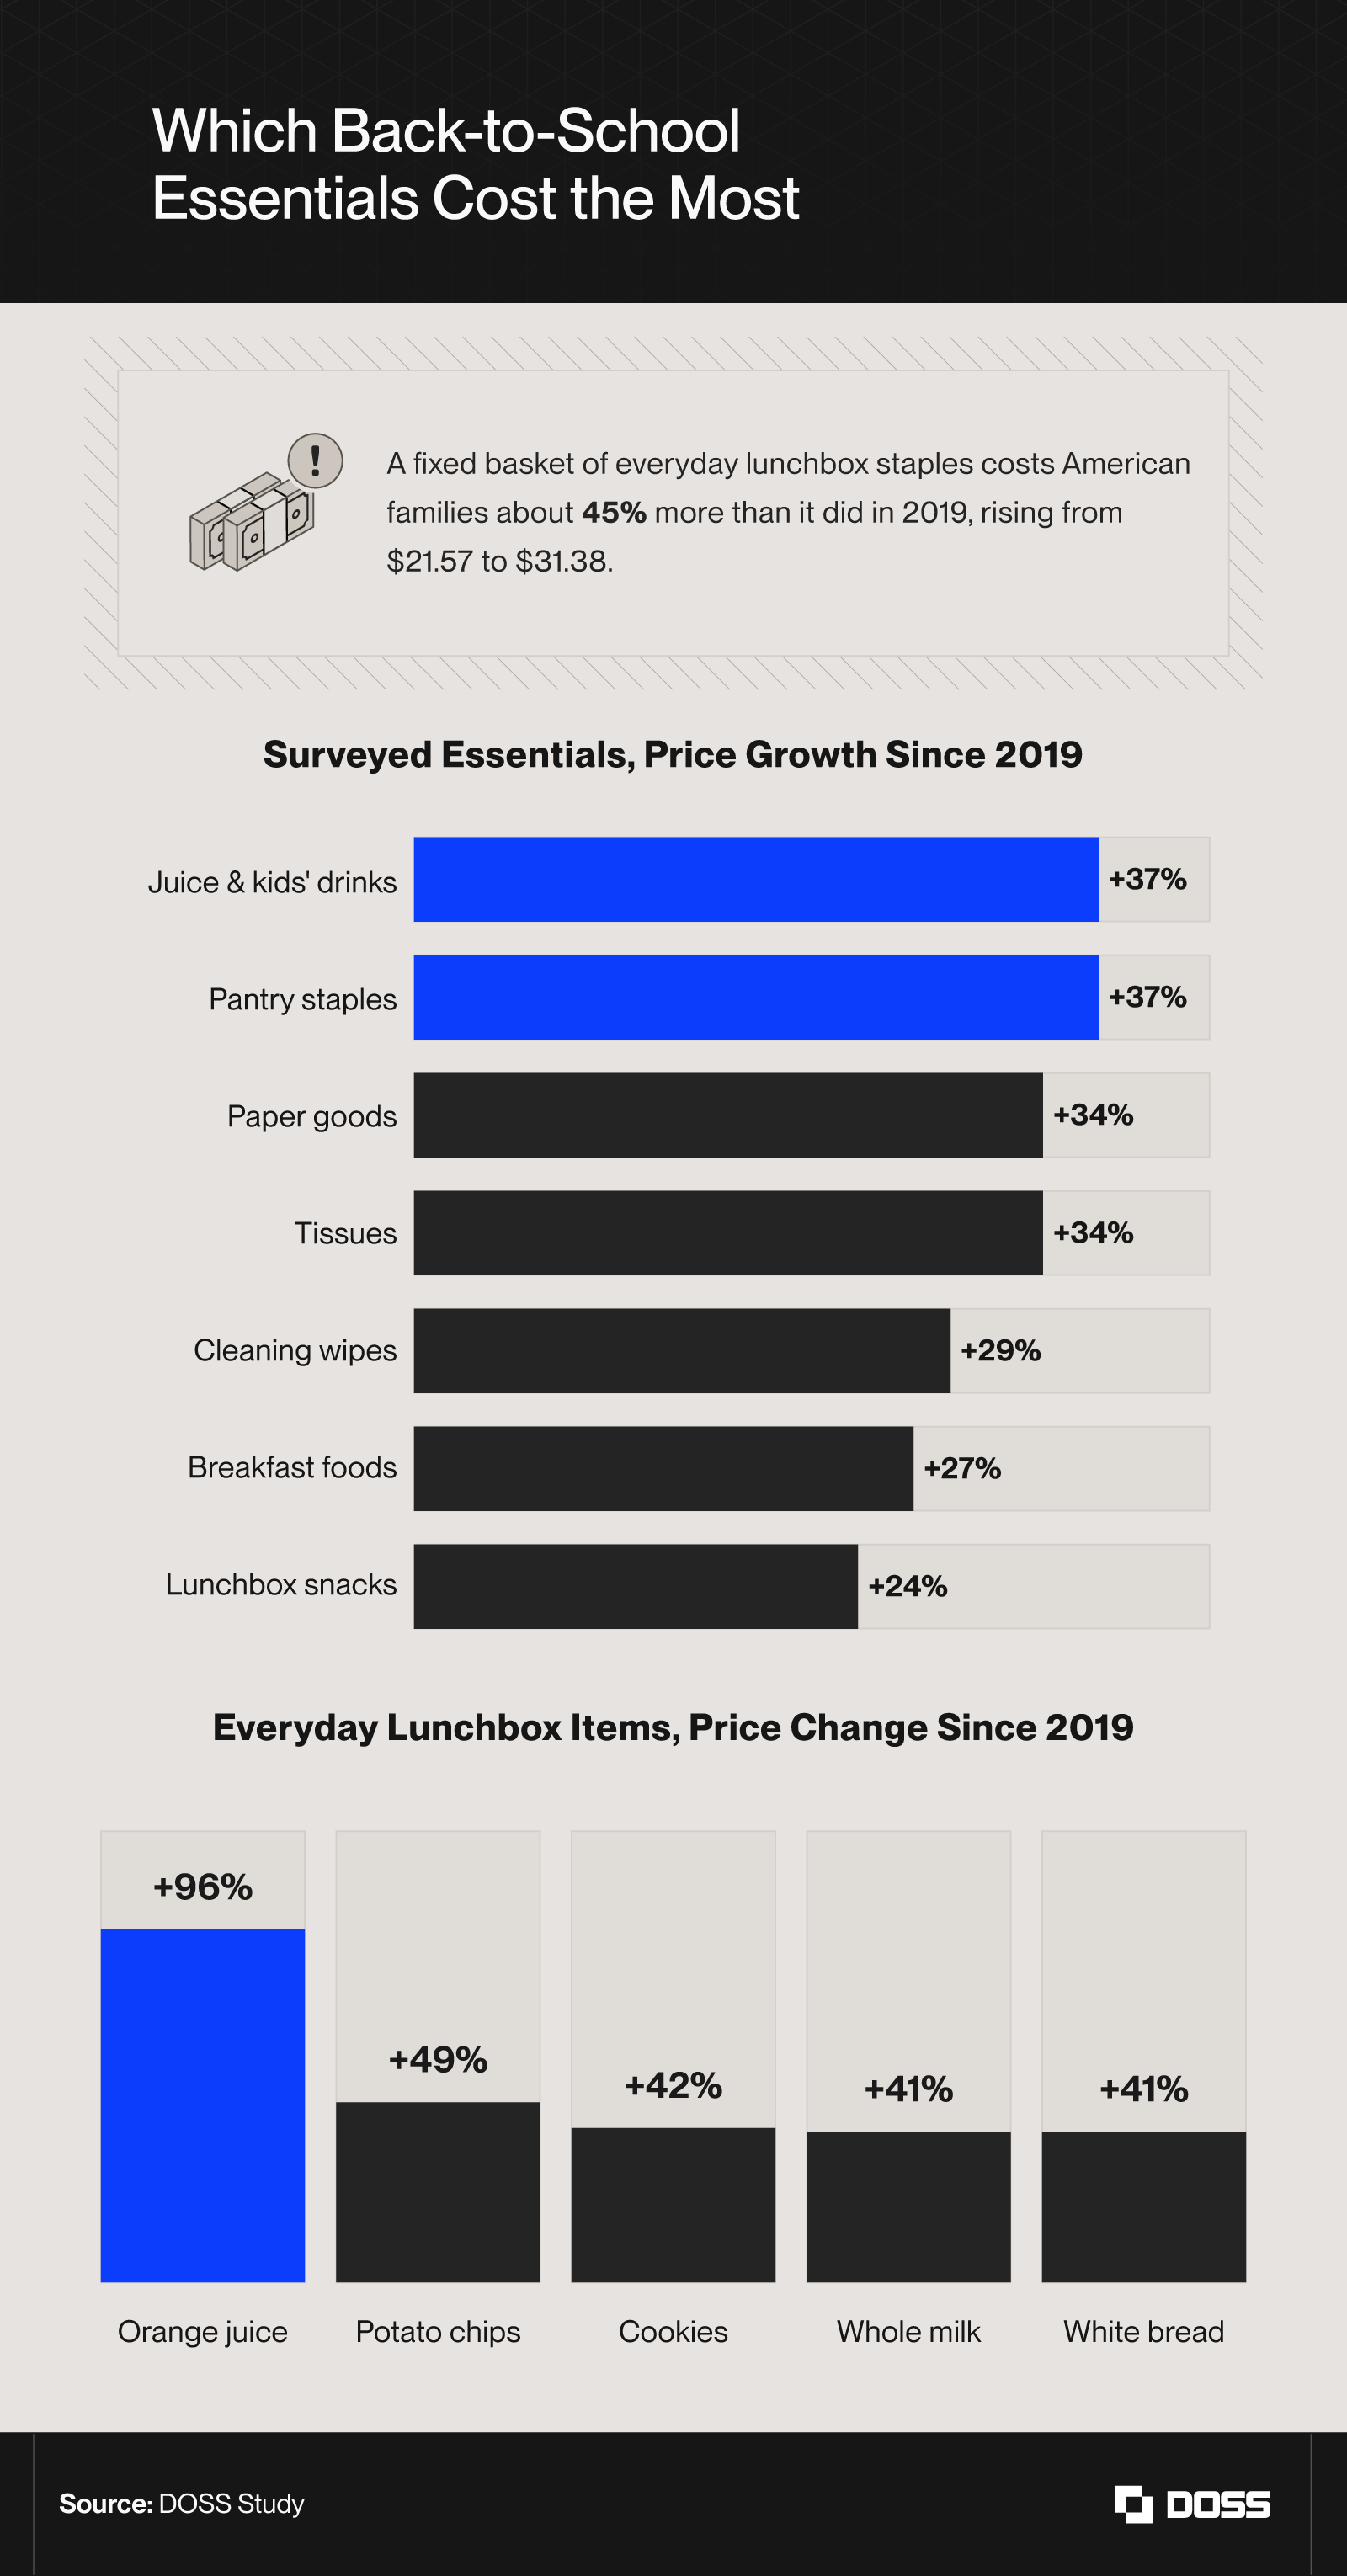
Alt text: Bar charts showing back-to-school essentials and lunchbox items up 24% to 96% since 2019.
- Every food and paper essential we surveyed parents about has experienced a price hike since 2019 that exceeds the all-items inflation rate of about 30%.
- A fixed basket of everyday lunchbox staples costs American families nearly 45% more than it did in 2019, rising from $21.57 to $31.38. The fixed basket includes one listed unit each of white bread, American cheese, eggs, whole milk, bananas, chocolate chip cookies, potato chips, frozen orange juice, and spaghetti or macaroni, each priced in the same unit in both June 2019 and June 2026.
- Orange juice costs nearly double what it did in 2019 (+96%), the steepest jump among common lunchbox items.
How Parents Are Trimming the Back-to-School Basket
Faced with higher prices, most parents are reworking what goes in the cart.
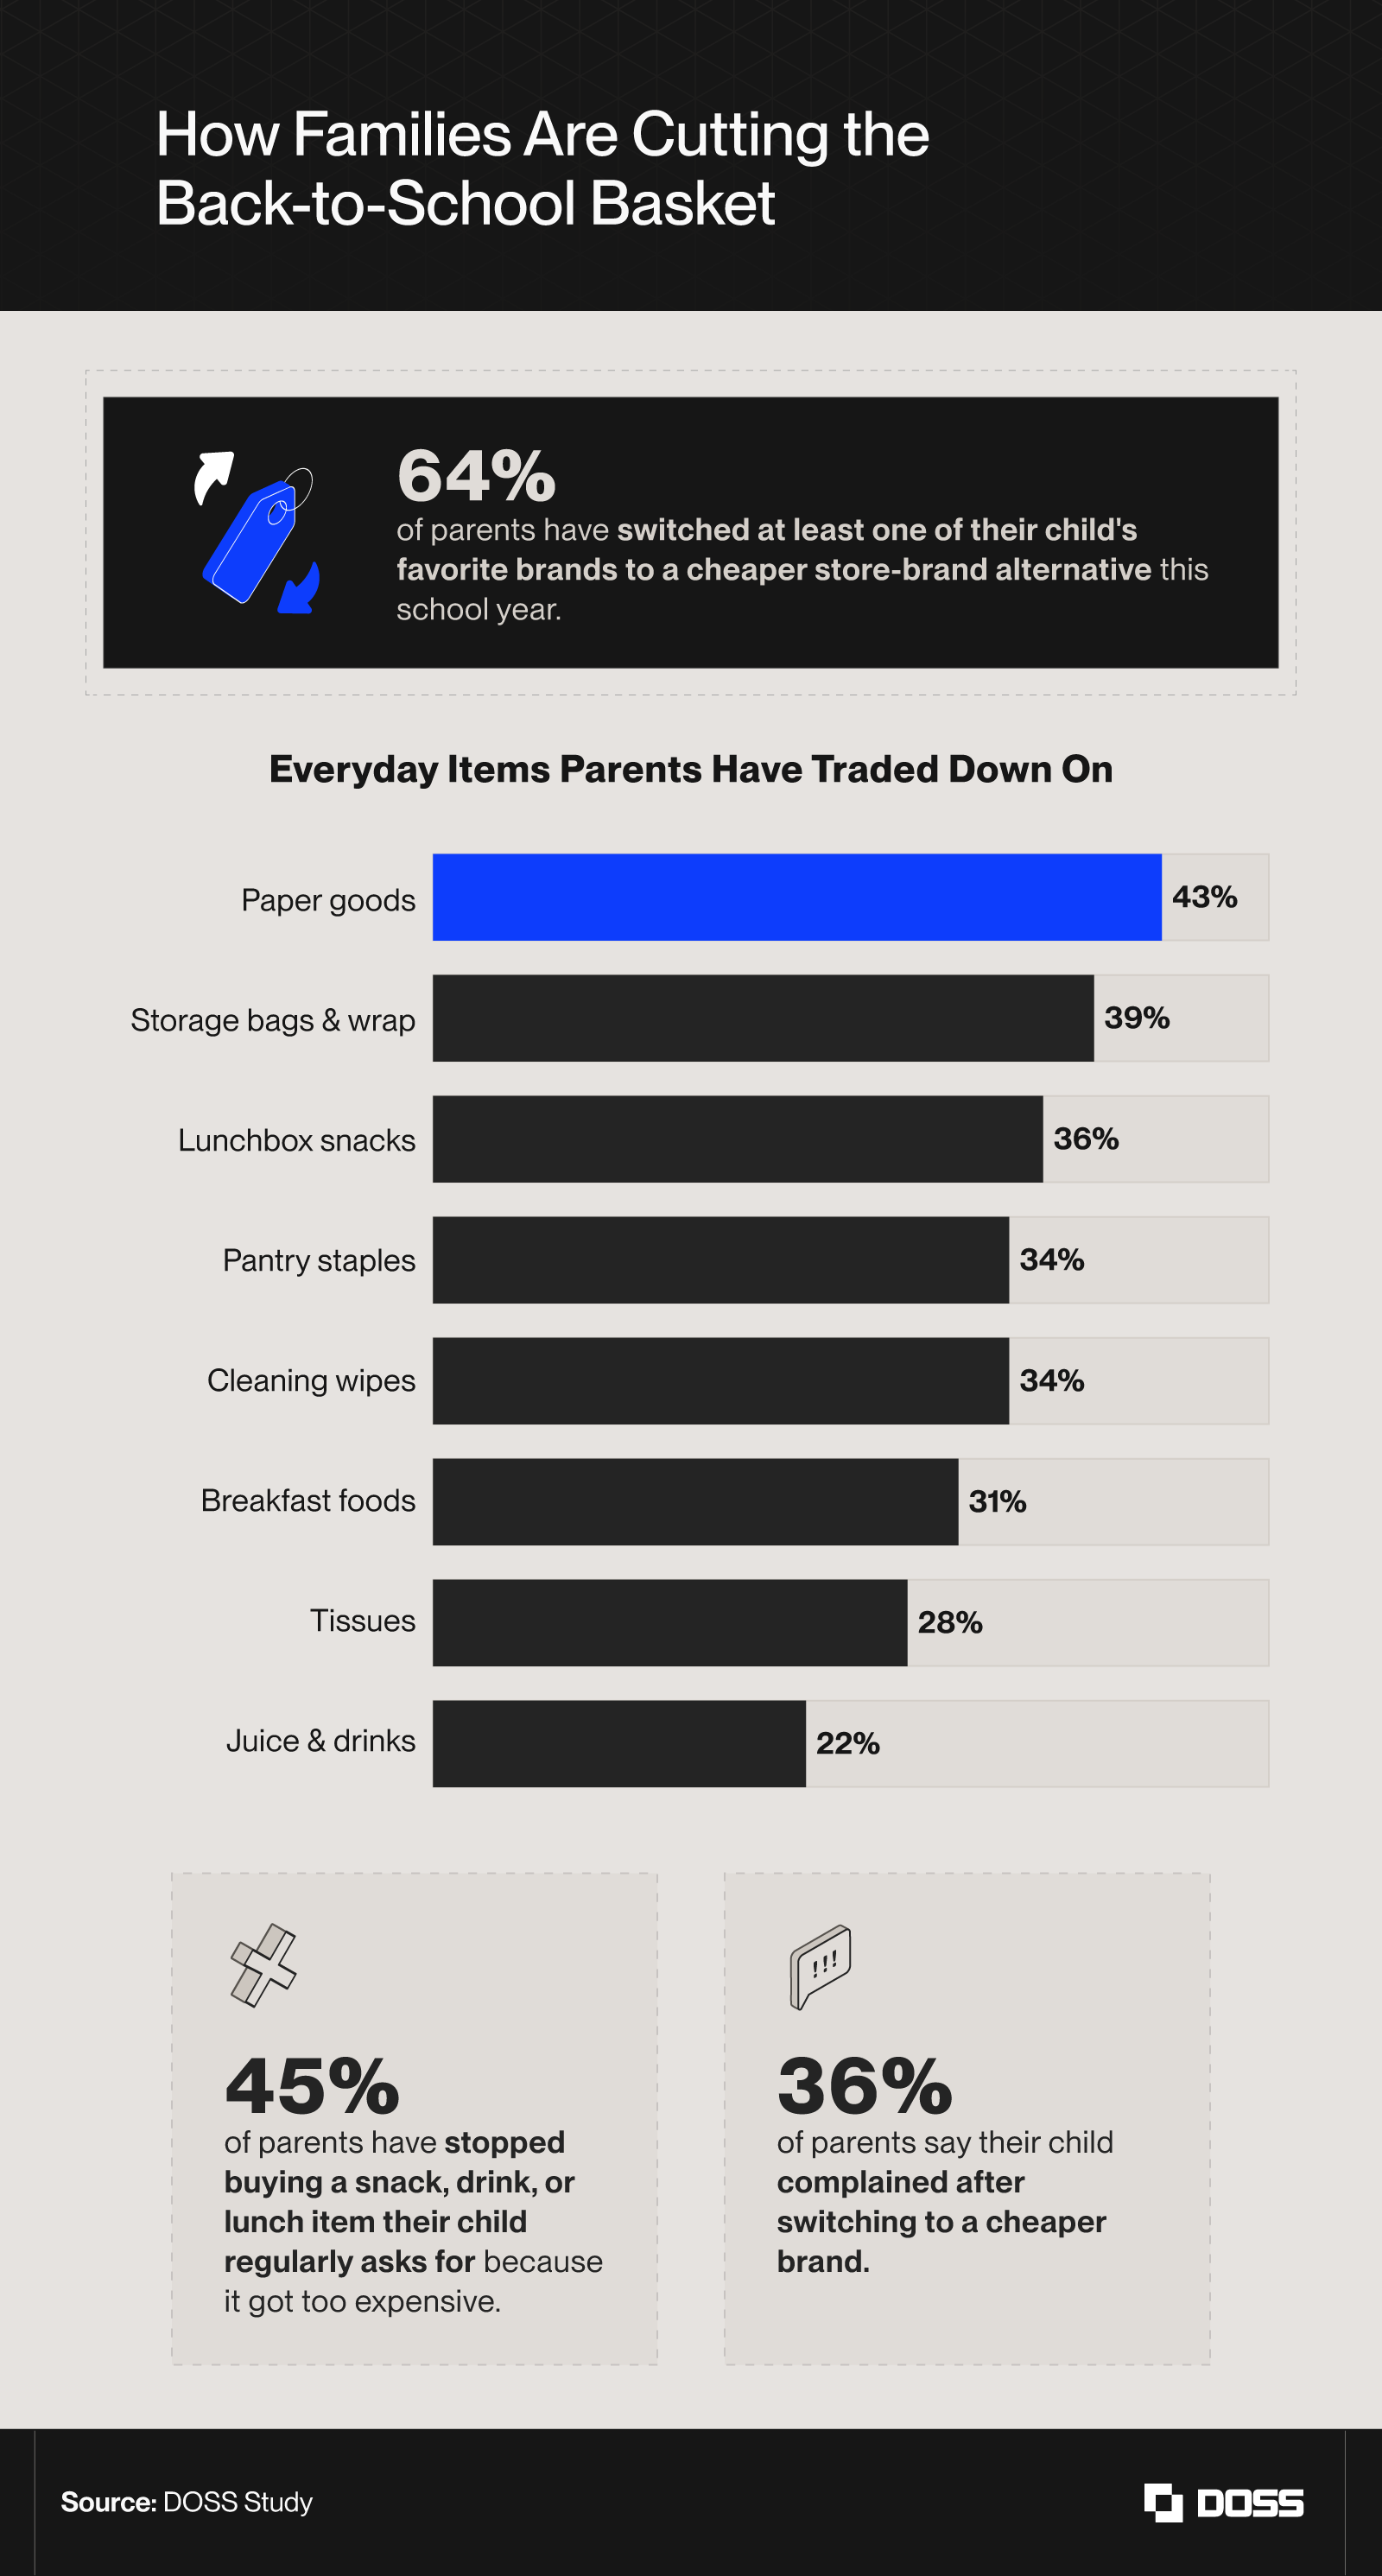
Alt text: Infographic showing 64% of parents switched a child's favorite brand to a cheaper option this year.
- Parents expect to spend a median of about $200 a month on everyday school-year consumables, and 71% say that's higher than last year's spending.
- Nearly half of parents (45%) have stopped buying a snack, drink, or lunch item their child regularly asks for because it got too expensive.
- 49% of parents earning under $50K have stopped buying an item their child asked for, and 38% of those earning $100K or more have done so as well.
- When cutting back, parents most often refuse to compromise on breakfast foods, with over a quarter (26%) protecting them.
Opting for a Cheaper Brand
- 64% of parents have switched at least one of their child's favorite brands to a cheaper store-brand alternative this school year.
- Mothers have traded down more than fathers. Nearly half of women (48%) have switched to cheaper paper goods, compared with a third of men (33%).
- 71% of parents earning under $50K have switched a favorite brand to a cheaper option, as have 55% of those earning $100K or more.
- Over 1 in 3 parents (36%) say their child complained after they traded down from a favorite brand to a cheaper one.
- About 2 in 5 parents earning under $50K (41%) strongly agree that they're buying fewer name-brand products, compared with over 1 in 5 of those earning $ 00K or more (22%).
- Breakfast brands topped the swap list. Nearly 3 in 10 parents (28%) replaced Pop-Tarts, and over a quarter (26%) replaced Eggo with cheaper alternatives.
What Teachers Are Covering Out of Pocket
Teachers are feeling the same price pressures, and many are making up the difference themselves.
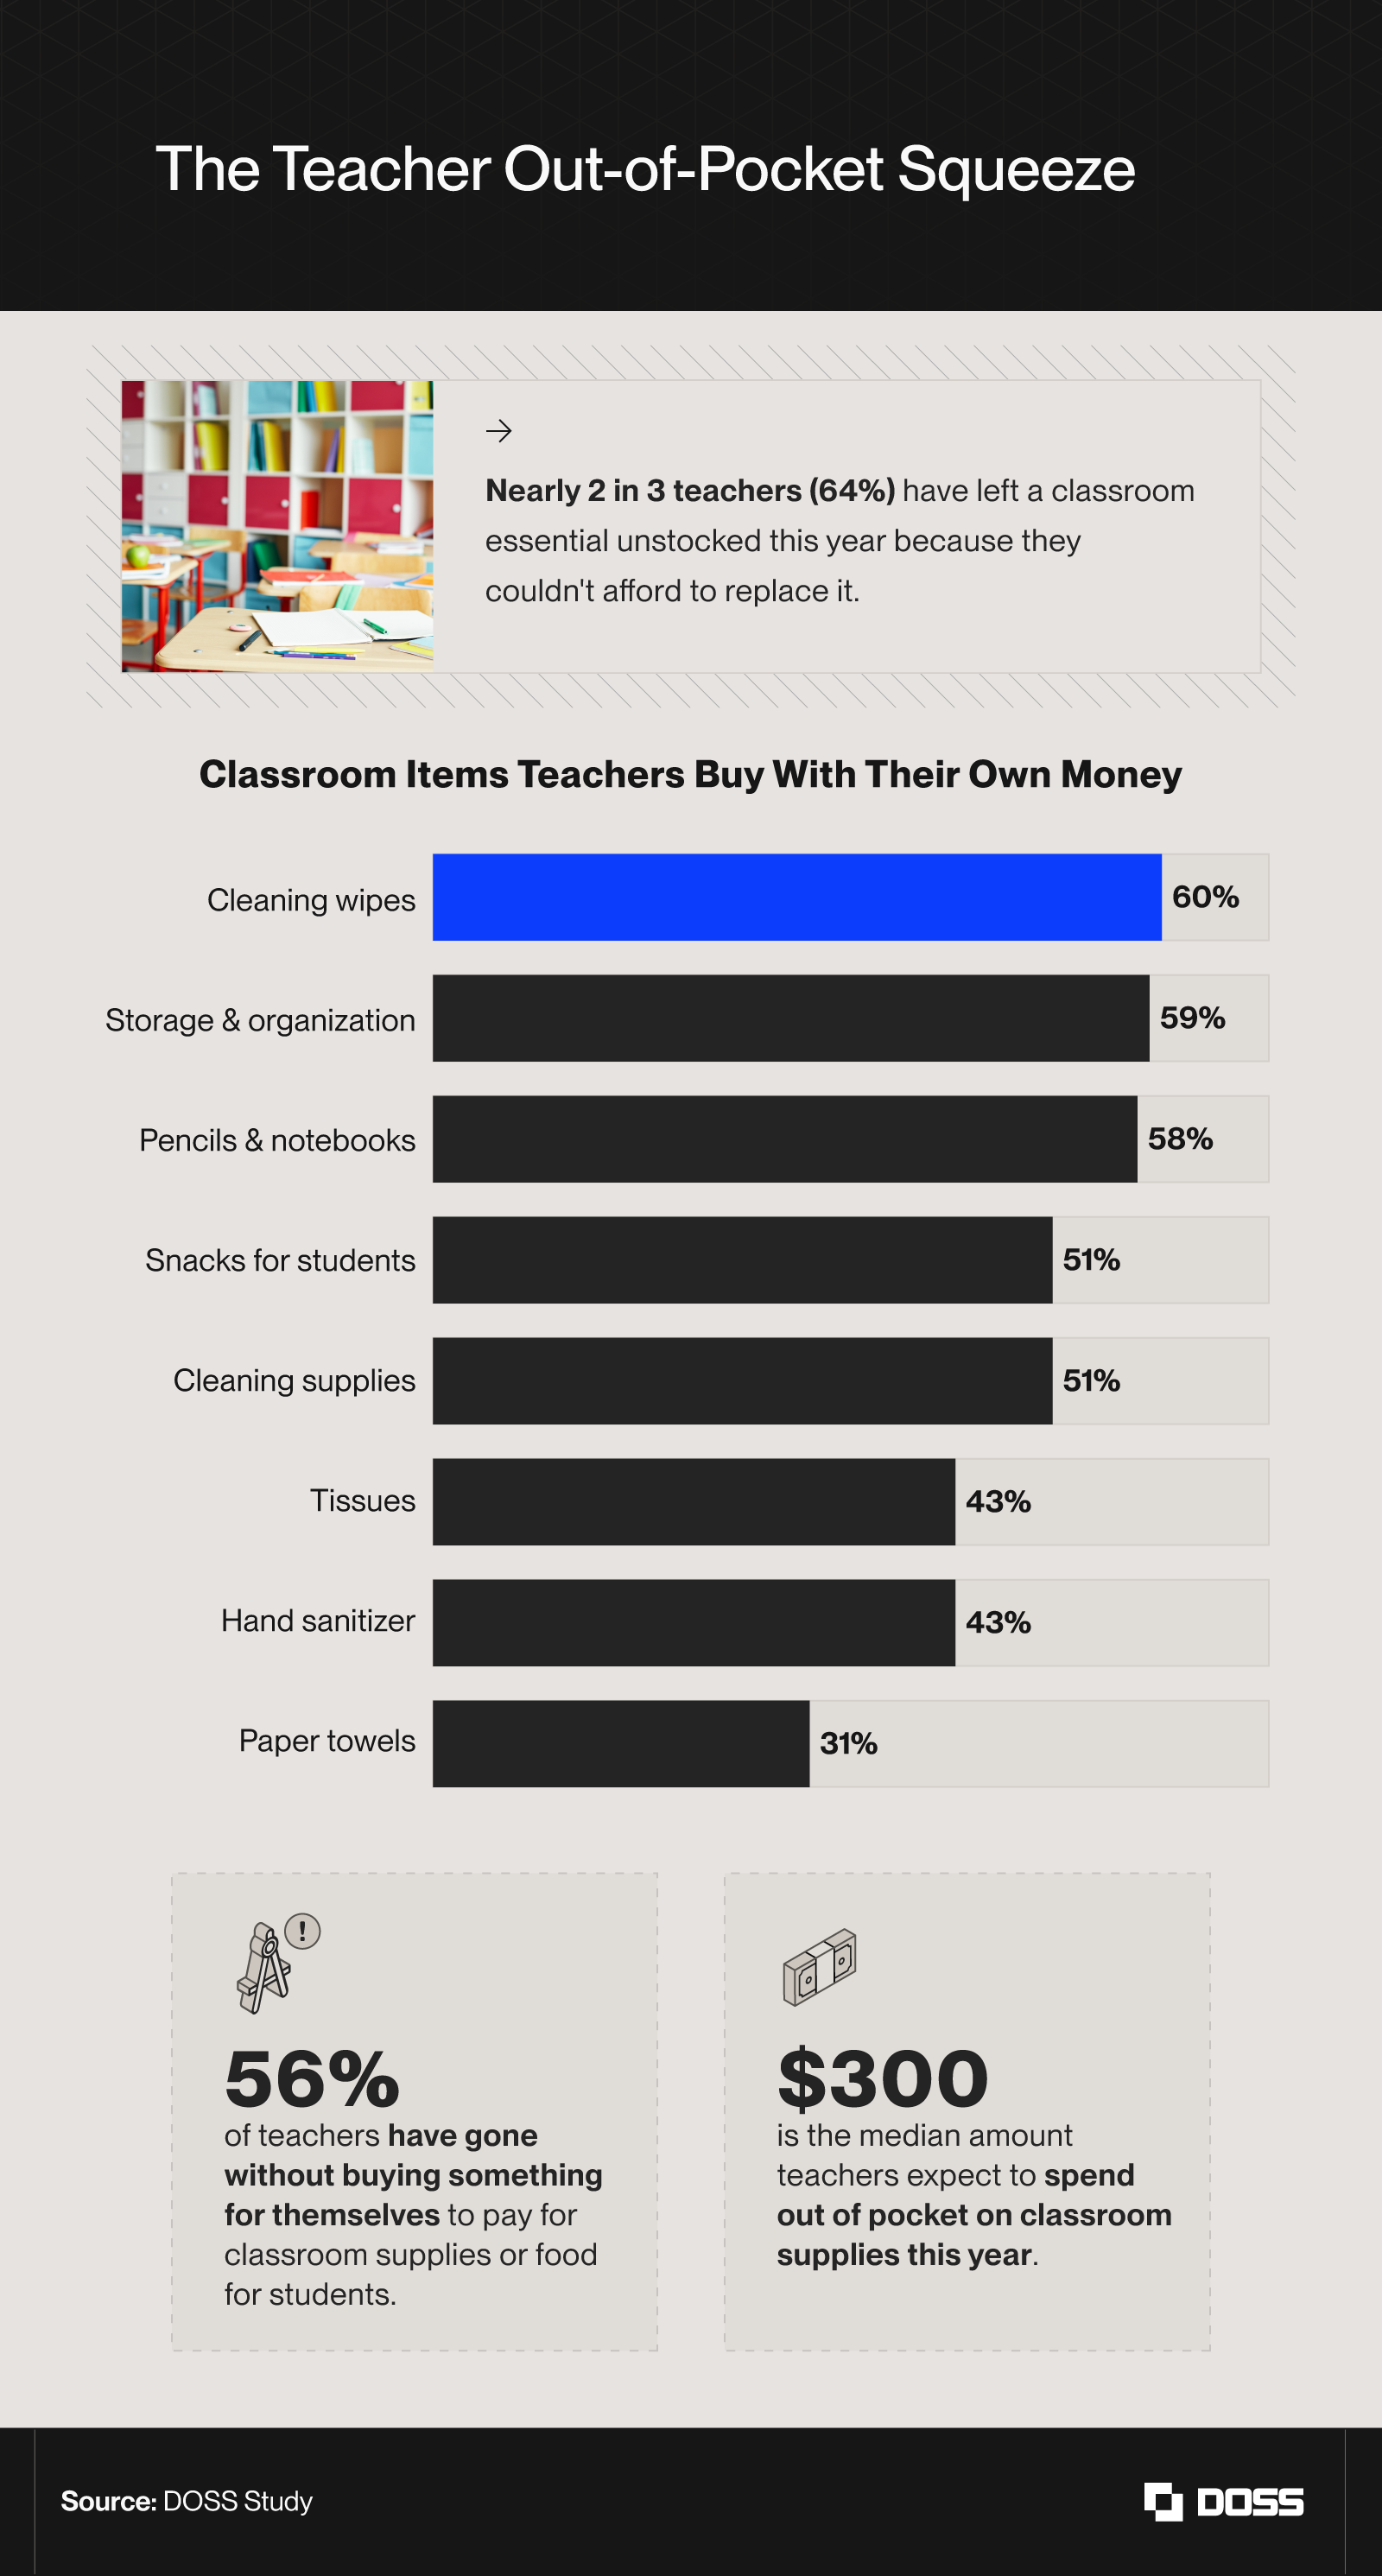
Alt text: Infographic showing 64% of teachers left a classroom essential unstocked because they couldn't afford it.
- Nearly 2 in 3 teachers (64%) have left a classroom essential unstocked this year because they couldn't afford to replace it, including 69% of women and 53% of men.
- More than half of teachers (56%) have gone without buying something for themselves to pay for classroom supplies or food for students, with 58% of women and 50% of men reporting this.
- Female teachers also expect to spend more of their own money ($300 median) than male teachers ($213 median).
- Only 1 in 20 teachers (5%) say their school fully provides or reimburses these consumables, while more than half (52%) cover most or all of the cost themselves.
- Nearly 4 in 5 teachers (79%) agree their school's supply budget has not kept up with rising prices.
- Snacks or food for students are the consumables teachers find hardest to keep stocked, cited by 30%.
- Over half of teachers (51%) ask parents or families to donate supplies to fill the gap.
Methodology
DOSS surveyed 811 U.S. parents of K-12 children and 205 U.S. K-12 teachers in 2026. All participants were adults age 18 or older. Among parents, the average age was 42. Women made up 65% and men 34%. Generationally, 66% were millennials, 28% were Gen X, 5% were Gen Z, and 1% were baby boomers. Parents spanned household income tiers, including under $50K (23%), $50K to $99K (39%), and $100K or more (37%).
Among teachers, the average age was 41. Women made up 69% and men 29%. Generationally, 44% were millennials, 32% were Gen X, 19% were Gen Z, and 5% were baby boomers. They taught elementary (47%), middle (20%), and high school (33%) grades. Only subgroups with at least 25 respondents and at least 5% of their sample are reported, and percentages may not sum to 100% due to rounding.
Pricing figures come from the U.S. Bureau of Labor Statistics CPI-U category indexes and Average Price data (U.S. city average, not seasonally adjusted), comparing a June 2026 reference month against June 2019. The fixed grocery basket includes one listed unit each of white bread, American cheese, eggs, whole milk, bananas, chocolate chip cookies, potato chips, frozen orange juice concentrate, and spaghetti or macaroni, each priced in the same unit in both years, so the 45% change reflects a valid fixed-basket comparison. Over that span, the all-items index computed to a 30.4% increase.
About DOSS
DOSS is the AI-native operating system for consumer goods, a single source of truth for procurement, inventory, and orders. The system adapts as the business changes and tightly integrates operations with financial accounting. DOSS provides inventory numbers the business can trust, contribution margin to the line-item level, and the ability to launch a new channel in days, driving growth and profit for growing consumer goods brands. Learn more at www.doss.com .
Fair Use Statement
You are welcome to share this research for noncommercial purposes. When you do, please link back to this page so readers can access the full study and methodology, and credit DOSS as the original source.