




A new product launch breaks every forecasting model built on sales history, because there is no sales history yet. Teams that try to force a new SKU into the same moving-average model they use for the rest of the catalog end up with a number pulled out of thin air, dressed up to look like math. The result is either a stockout in the first month, when a launch does better than the placeholder number assumed, or a warehouse full of unsold inventory when it does worse.
New product demand forecast accuracy does not come from a better formula. It comes from a different method entirely, one built around the information you do have (comparable products, planned distribution, and the marketing spend behind the launch) rather than the information you don't. This article walks through that method and where it needs to connect to the rest of your operations to actually work.
Why Standard Forecasting Models Fail on New SKUs
Every statistical forecasting model, from a simple moving average to a full regression, needs historical data to find a pattern. A new SKU has none. Whatever number a planner enters for month one is effectively an assumption, not a calculation, no matter how it is dressed up in a spreadsheet formula.
The common workaround, taking last year's launch and applying the same growth curve to this year's, fails for a specific reason: it assumes every launch behaves like every other launch, regardless of category, price point, or distribution plan. A $4 snack bar launching into 500 convenience stores and a $28 supplement launching direct-to-consumer will have completely different demand curves in the first 90 days, and a shared growth curve template will be wrong for one of them by a wide margin.
The other common workaround, asking sales or the brand team for "their number," has a different failure mode: incentives. A sales lead building a plan around a launch target has reason to forecast optimistically, and a supply chain team burned by a recent overstock has reason to forecast conservatively. Neither number is dishonest, but neither is neutral, which is exactly why a documented, repeatable method matters more for a launch than for an established SKU where a spreadsheet's history can correct for an optimistic or pessimistic bias over time.
The Analog Method: Borrowing Demand Curves From Comparable Products
Launch forecasting works best when it borrows from a comparable product rather than inventing a curve from scratch. An analog SKU is a past launch that is similar on the dimensions that actually drive early demand: category, price point, distribution channel, and the size of the marketing push behind it. A new flavor extension of an existing bestseller has a much stronger analog (the original SKU's own launch curve) than a brand-new product entering a category you have never sold in before.
Once an analog is selected, the forecast borrows its shape, not just its total volume. A launch that ramps slowly over eight weeks before hitting a plateau looks very different from one that spikes in week one on launch marketing and tapers from there, and using the wrong shape leads to ordering the right total amount of inventory at the wrong time. If no strong analog exists inside your own catalog, a category-level analog from a competitor's public launch, estimated from retail sell-through data where available, is a reasonable substitute.
Building the Launch Forecast from Distribution and Velocity Assumptions
The analog gives you a shape. Turning that shape into a number requires two more inputs: planned distribution points and an assumed sell-through velocity per point. If a product is launching into 500 stores and the analog SKU sold an average of 3 units per store per week in its first month, the starting forecast is 1,500 units per week, adjusted up or down based on how the marketing spend compares to the analog's launch.
This is also where the forecast needs the most explicit documentation of its assumptions, because every one of those numbers (distribution point count, velocity per point, marketing spend ratio) is a placeholder until real sell-through data starts coming in. Writing the assumption down, rather than burying it inside a formula, is what makes it possible to identify which one was wrong when the actual numbers diverge from the forecast in week three.
A second, more conservative pass is worth running alongside the primary forecast: what happens if distribution slips by four weeks, a common occurrence when a retailer's reset calendar shifts, or if velocity comes in at 60% of the analog instead of 100%. Building the purchase order plan around a single point estimate means a single missed assumption turns directly into a stockout or an inventory write-down. Building it around a range, with a first purchase order sized for the conservative case and a follow-on order that scales up once early velocity confirms the optimistic case, protects the launch from the assumption that turns out to be wrong.
Setting Safety Stock for a SKU With No History
Safety stock for an established SKU is calculated from demand variability you can measure. For a launch, that variability is unknown, which means the standard formula does not apply cleanly. The practical approach is to set an initial safety stock buffer based on the widest plausible range from the analog method (the fastest and slowest comparable launches), rather than a single confident number, and to plan the first reorder point around the low end of that range to avoid tying up cash in a launch that underperforms.
Lead time matters more here than for a mature SKU, because a launch forecast is going to be wrong by a meaningful margin no matter how careful the method, and a long supplier lead time means less room to correct course once real sell-through data arrives. A launch with an eight-week supplier lead time needs a wider initial buffer than one that can reorder in ten days, purely because the second reorder decision happens sooner.
Choosing Between Multiple Analogs When None Is a Perfect Match
Most launches don't have one obvious analog; they have two or three imperfect ones, each matching on a different dimension. A new protein bar flavor might share a price point and distribution plan with one past launch but share a target customer and marketing channel with another. Rather than picking one, blend them: use the distribution-and-velocity analog to set the starting volume, and the customer-and-channel analog to set the ramp shape over the first eight weeks.
Document which analog drove which part of the forecast. When the real numbers come in and diverge from the plan, that documentation is what tells you whether the volume assumption or the shape assumption was the one that missed, instead of leaving the team to guess which part of a blended forecast to fix.
Correcting the Forecast Once Real Data Arrives
The first two to four weeks of actual sell-through data are worth more than the entire pre-launch forecasting exercise, because they replace an assumption with a measurement. The discipline that matters here is updating the forecast immediately once that data starts coming in, rather than waiting for the next scheduled planning cycle a month later. A launch tracking 40% below its analog in week two is a signal to slow down the next purchase order before it compounds into a bigger overstock problem, not a data point to file away for the monthly review.
This is where a launch forecast either becomes a living process or a one-time exercise nobody revisits. Teams that treat it as a single number handed to procurement at launch and then forgotten are the ones surprised by either a stockout or a warehouse of dead stock ninety days later.
By week eight, a launch usually has enough real data to retire the analog entirely and switch to a standard statistical model built on its own actual sales history. That transition point is worth marking explicitly, since a team that keeps leaning on the original analog assumptions past the point where real data is available is ignoring the more reliable signal sitting right in front of them.
How DOSS Keeps Launch Forecasts Connected to the Rest of the Business
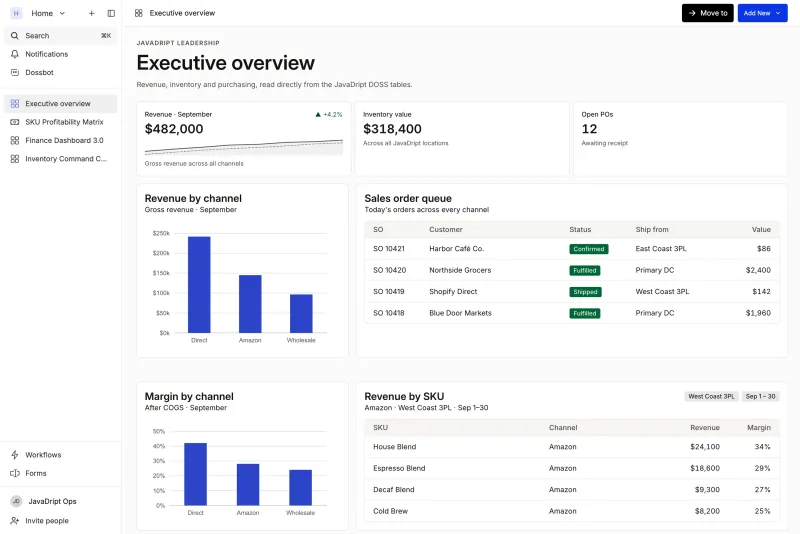
DOSS, the AI-native operations platform for consumer goods, does not build the analog forecast for you. It removes the biggest reason launch forecasts stop getting updated: the disconnect between the forecast, the purchase order, and the inventory position. Because inventory management , order management , and procurement run on one system of record that matches the real world, a planner watching early sell-through on a new SKU can see the gap against the launch assumption and adjust the next purchase order in the same system, without exporting numbers between three tools first.
That matters most in the window where launch forecasts are least reliable and most in need of a fast correction. A new product's first month is not the time to wait on a spreadsheet reconciliation. Teams can build a Dynamic App that compares actual velocity to the analog, and Dossbot can answer questions on live data with source attribution, which is why launch forecasting works better as a connected process than as a one-time exercise handed off at kickoff.