




Most CPG operators forecast demand the same way for years: pull last year's numbers, add the growth rate the CEO wants to see, and adjust up or down based on what "feels right" for the season. It works, mostly, until a retailer resets a planogram, a competitor launches a private-label version of your bestseller, or a TikTok trend triples demand for one SKU while the rest of the line sits flat. Gut feel does not see any of that coming.
CPG demand forecasting built on statistical models is not a replacement for the operator's judgment built from years of running the business. It is a way to make that judgment more accurate by grounding it in patterns the human eye misses across hundreds of SKUs, dozens of accounts, and years of seasonality. This article compares the core statistical models CPG teams actually use against gut-feel planning, and where each one earns its place.
What "Gut Feel" Forecasting Actually Gets Wrong
Gut-feel forecasting is not guessing. It is pattern recognition, run by one or two experienced people, applied inconsistently across a growing SKU catalog. That inconsistency is the problem. A demand planner who has run the numbers for five years knows that the flagship SKU dips in February. They may not remember that a newer SKU has a completely different seasonality curve because it sells primarily through a different channel.
The failure mode compounds with scale. At 50 SKUs and one sales channel, one person's intuition can cover the surface area. At 400 SKUs across DTC, wholesale, and three retail chains, no single person holds enough pattern data in their head to catch the interactions between channel mix, promotional calendars, and seasonality. The result is safety stock that is too high on slow movers and too low on the SKUs actually driving growth, a pattern that shows up as tied-up cash on one end and stockouts on the other.
Spreadsheets do not fix this. A spreadsheet can hold a moving average formula, but it cannot flag when a forecast error is trending in one direction for three months running, and it will not talk to your purchase orders or your inventory counts without someone manually updating it. The forecast becomes a document that gets reconciled with reality once a month, not a system that adjusts as new orders come in.
The Baseline Statistical Models
Three models cover most of what a growing CPG brand needs before reaching for anything more sophisticated.
Moving average forecasts the next period as the average of the last several periods, smoothing out short-term noise. It is simple to calculate and reasonably accurate for stable, low-seasonality SKUs, but it lags behind real trend changes because it weighs old and recent data equally.
Exponential smoothing fixes that lag by weighting recent periods more heavily than older ones, so the forecast reacts faster to a genuine shift in demand. Holt-Winters, a common extension, adds trend and seasonality components, which makes it a meaningful step up for any SKU with a predictable seasonal pattern, like sunscreen or holiday gift sets.
Regression-based forecasting goes further by tying the forecast to causal variables: price changes, promotional spend, distribution point count, or even weather. This is where forecasting starts to reflect the actual drivers of demand rather than just its historical shape, but it requires clean, structured data across those variables, which is exactly where most CPG operators get stuck. The model is only as good as the data feeding it, and if pricing lives in one system, promotions in a spreadsheet, and distribution counts in a third, building that dataset becomes a project in itself.
How to Tell Whether Your Forecast Is Actually Working
Forecast accuracy is measurable, and most CPG teams never measure it. Mean Absolute Percentage Error (MAPE) compares forecasted units to actual units sold and expresses the gap as a percentage, which makes it easy to compare accuracy across SKUs with very different volumes. A MAPE of 20% on a top-selling SKU is a much bigger dollar problem than the same MAPE on a slow mover, which is exactly why tracking accuracy only in aggregate hides where the real cost sits.
Bias is the second number worth tracking, separately from accuracy. A forecast can be consistently wrong in one direction, always high or always low, and still show a moderate MAPE. Consistent overforecasting quietly inflates safety stock and ties up cash in inventory that turns slowly. Consistent underforecasting shows up as repeat stockouts on the same SKUs, usually the ones growing fastest, which is the worst place for a stockout to happen. Tracking bias by SKU for a full quarter is often the fastest way to find out that one category has been systematically mis-forecast the entire time.
Neither number matters if nobody reviews it. The teams that improve forecast accuracy over time treat the monthly review as a standing process: pull the SKUs with the worst MAPE, ask whether the miss came from a bad model assumption, a missing promotional flag, or a genuine demand shift the model could not have caught, and adjust the process accordingly. Teams that skip this step keep making the same category of mistake indefinitely, because nothing in a spreadsheet forces the retrospective to happen.
Where Gut Feel Still Wins
None of this means intuition should be discarded. Statistical models are blind to information that has not happened yet: a new retail partnership signed last week, a supplier quality issue that will force a reformulation, or direct feedback from a buyer that a reset is coming. An experienced operator holds that context, and a forecast that ignores it will be confidently wrong.
The strongest forecasting processes treat the model as the default and the operator's judgment as the override, applied deliberately and logged, not applied silently to every number out of habit. That distinction matters because an override that is never tracked never gets evaluated, and the team never learns whether the human adjustment made the forecast better or worse.
Building a Forecasting Process That Actually Adapts
Getting from spreadsheet forecasting to a statistical process is not about buying better forecasting software in isolation. It is about connecting the demand planning process to the systems that generate the data it depends on: point-of-sale and order history, current safety stock levels, lead time by supplier, and promotional calendars. When those live in disconnected tools, someone has to manually stitch them together before any model can run, and that manual step is usually where the process breaks down under growth.
The practical path most CPG teams take: start with exponential smoothing on your top 20% of SKUs by revenue, since that is where forecast error costs the most in tied-up cash and stockouts. Layer in regression variables only where you have clean data (price and promotion are usually the easiest to start with). Track forecast accuracy by SKU monthly, not just in aggregate, since an aggregate number can look fine while individual SKUs are badly off in opposite directions.
This is also where most forecasting rollouts stall. A planner picks a model, builds it in a separate forecasting tool or a new spreadsheet, and gets a reasonably accurate number for next month. Then that number has to be turned into actual purchase orders, checked against current inventory, and reconciled with what suppliers can actually deliver by their lead time. If those steps require exporting the forecast and re-entering it somewhere else, the forecast decays in value the moment it is finished, because by the time it reaches procurement, the inventory position it was based on has already changed.
The fix is not a better spreadsheet template. It is removing the export-and-reconcile step entirely, so the forecast, the current inventory count, and the open purchase orders are reads against the same data rather than three separate exports that have to be manually kept in sync.
How DOSS Connects Forecasting to the Rest of Operations
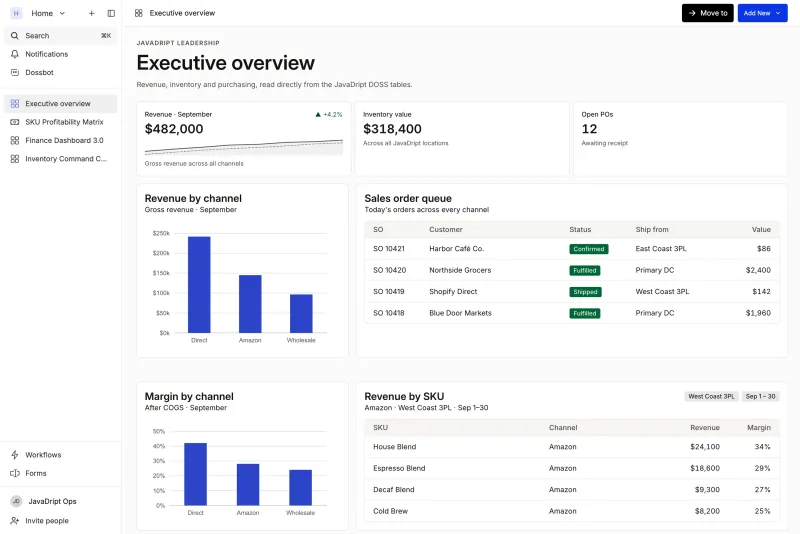
DOSS, the AI-native operations platform for consumer goods, does not replace the statistical model itself, but it solves the problem underneath it: the data those models need rarely lives in one place. Because DOSS puts procurement, inventory, and order data on one system of record that matches the real world, built on Unified Master Data, a forecast built on last month's sell-through and current reorder points is working from numbers that are accurate today, not numbers that were exported and went stale three weeks ago.
That matters more as the SKU count grows. Teams running inventory management and procurement on DOSS see actual inventory positions, lead times, and open purchase orders in the same system. A planner adjusting for an upcoming promotion can see what that means for purchasing right away, and Dossbot can act on it with approval, such as flagging a mismatch or preparing the next order, instead of waiting for someone downstream to notice the change.
Better forecasting is not a one-time model selection. It is a process that gets more accurate as the underlying data gets more connected, and DOSS is built for that: a system of record that matches the real world and adapts as your business changes, which legacy ERPs and disconnected spreadsheets were never built to do.