Safely Scaling a Live System That’s Grown 2 OOM
There’s a certain irony to how my interviews at DOSS played out. One of the first questions I was asked in the process was, “You’ve been tasked with debugging a slow loading website. What do you do?”.
Lo and behold, one year later I’m writing a blog post about a web application that ground to a halt, and how I got it running again.
I spent the better part of the last few weeks taking a system that was laden with layers of tech debt that had crushed the JavaScript client-side event loop, and peeling it apart to create our next-generation front-end foundation.
The Buildup
For three months, our platform team had been racing to get our infrastructure ready for our biggest customer to date, an order of magnitude larger than anything we had handled before: hundreds of incoming webhooks per second, 10x larger database tables, and a sprawling relationship graph of entities. The backend engineers had done incredible work getting our database layer ready for this kind of load.
Now it was time for the frontend team to carry the ball forward. As soon as the customer went live, the backend platform held up, but the web application began to drown under the increased system load.
P0: Unusable UI
When we logged into the app and opened their tables, we saw quite a story. With an extremely high volume of sales orders coming in, the visual table size was exploding.
Our spreadsheet-like data grid uses subscriptions to surface incoming orders in real time. However, the volume of updates we were receiving was effectively breaking the UI.
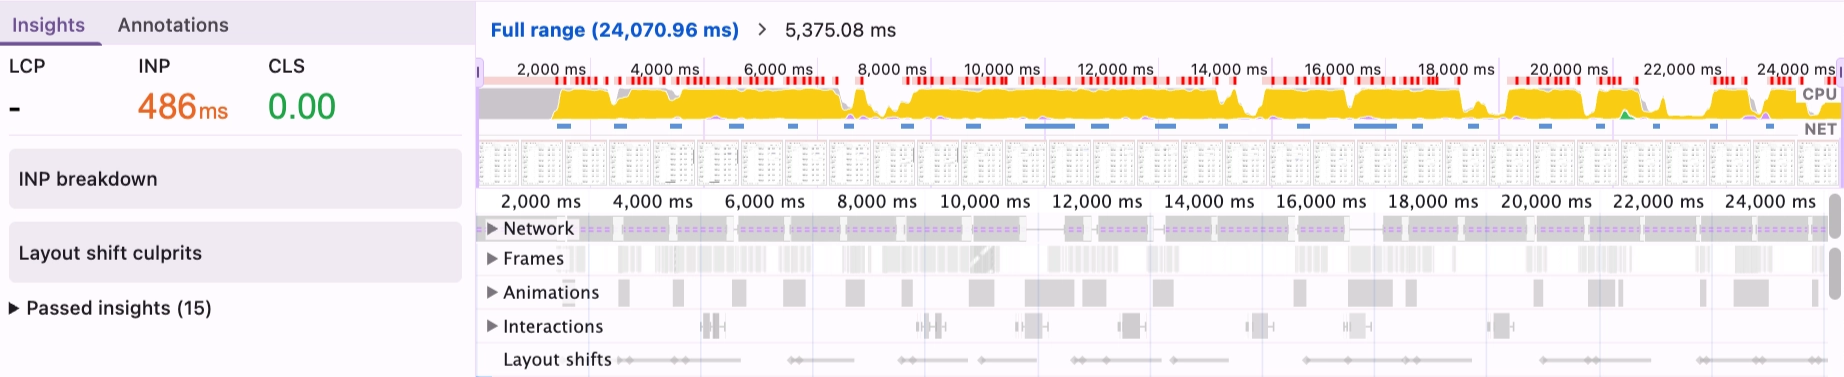
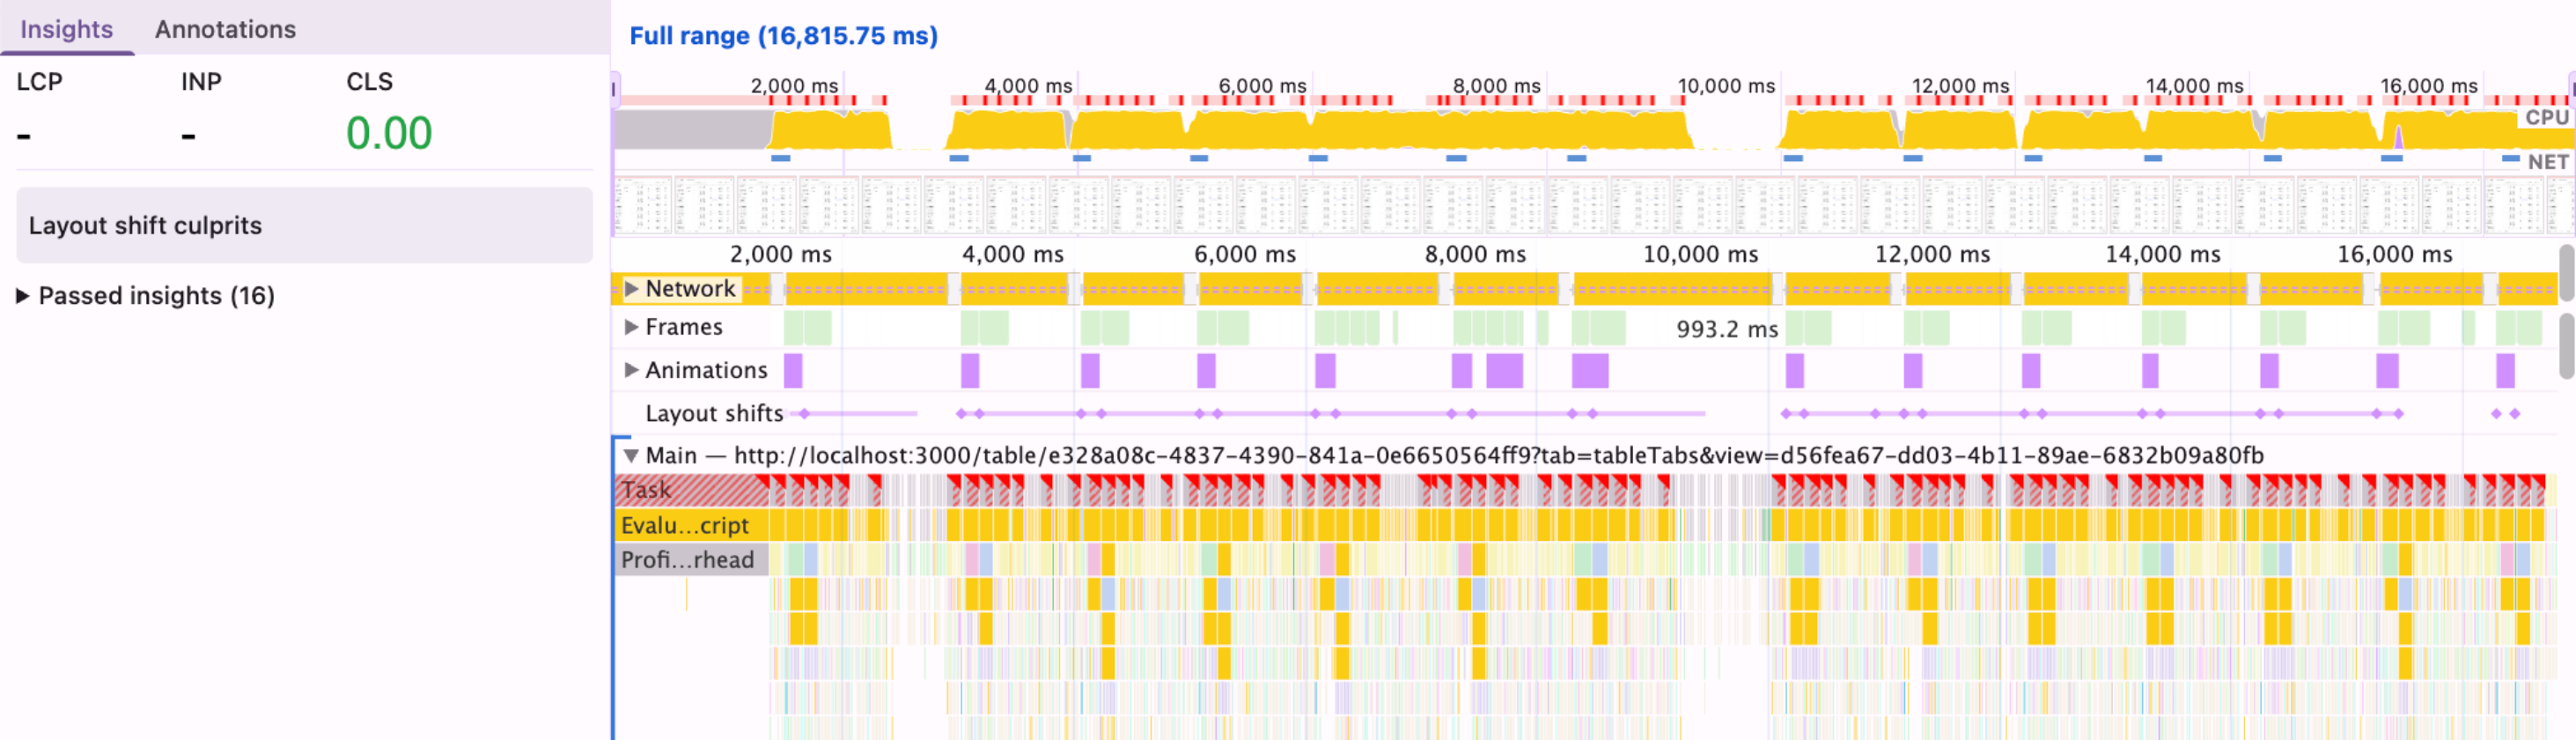
Within seconds of opening the page, it was nearly impossible to interact with anything: editing cells, switching tabs, even just navigating off of the page. A quick look at DevTools showed a steady 100% CPU, sometimes for as long as 10 seconds at a time.
I was assigned the task of making the UI… not broken. But I was excited; it was time to make that interview come true, and it seemed like a fun puzzle to solve.
My hunch was that the problem lived in our datagrid’s core renderer, a ~1,700 line component that is essentially the heart of our application. This component drives how every customer views and interacts with their data: cell editing, sorting and filtering, bulk uploads, 8 real-time subscriptions, etc. Long overdue for a refactor, and I thought this might be a chance to scratch the surface of that.
As with any great story, the pressure was on. The UI was freezing on almost every interaction. Demos were falling apart. The customer was not happy. If we didn't fix this immediately, the entire install was at risk.
Operating Under Constraints
Under different circumstances, the right answer would have been a refactor or even rip-and-replace . The table component was big, organically grown (parts of it by engineers who were no longer at the company), and had accumulated too many responsibilities over time. But with the time constraint and the stakes, rebuilding the highest-traffic component in the application was completely off the table.
So the challenge was two-fold: figure out where the problem actually lived, and fix it without breaking anything. If the latter happened, we might end up trading one P0 for another.

Vibe Debugging?
My first instinct was to throw the component at Claude Code with extensive prompting about the performance issues. When dealing with a problem as sensitive as a P0, using agents to solve the problem can be risky; However, using agents to get oriented is an immense time-saver. They could explain the structure and walk me to the hot spots in the components.
Unfortunately, when it came to the actual solution, OpenAI and Anthropic kept coming back to the same answer: memoize everything. That wasn't going to cut it. Memoizing everything in a 1,700-line component, without understanding which renders are actually expensive, was more likely to introduce bugs than magically fix everything.
We have a principle in the company called “BIDEC”: Break it Down, Execute, Communicate. It was time to do some good ol’ fashioned BIDEC-ing to the root.
I pulled up Chrome DevTools and React DevTools and started recording. The traces were eye-opening: every time a subscription event fired, DossTable was re-rendering up to 20 times: all 1,700 lines of computed values, column configurations, and row transformations, stacking up and choking the main thread with orders coming in every second.
My approach shifted from “how do I make this component faster in general?” to “why is every subscription event causing 20+ re-renders, and what’s the minimum change that fixes that?”.
The profiler also shaped how I prioritized. The goal wasn't to fix everything, but instead to find the highest-leverage 80/20 changes that I could ship with confidence and measure. I tried to stay disciplined: each PR had to be small enough to reason about completely, test in isolation, and roll back if needed.
Small Changes, Big Impact
After the initial profiling and tracing through the code, I identified two issues that accounted for the vast majority of the problem. Neither was a sweeping architectural fix, but instead were small, targeted changes that the constraints had forced me to look for.
Apollo’s ignoreResults: true
Every one of our 7 table-level subscriptions was using Apollo's useSubscription hook with a custom onData handler. The onData callback would handle the event, usually by throttling and then triggering a table data refetch. This was intentional.
What wasn't intentional: without ignoreResults: true, Apollo was also writing subscription data to its cache and, by default, triggering a component re-render on every event. Each subscription event was effectively hitting the component twice: once through onData (wanted), and once through Apollo’s automatic re-render (not wanted). Adding ignoreResults: true – a relatively new Apollo option – meant the callback fired without the extra render.
We Were Rendering DossTable Twice
The parent component that renders DossTable had a responsive layout that rendered both desktop and mobile versions simultaneously, using Tailwind's hidden class to toggle visibility. CSS hidden doesn't unmount a component, so we had two fully mounted DossTable instances, each with their own 7+ subscriptions, each processing every incoming event. Double the work, zero benefit.
Switching to conditional rendering so only one instance mounts at a time was a small structural change with an outsized effect. I verified it carefully before shipping, making sure the switch between layouts still worked and that no subscription state was lost in the process.
Before:
After:
Additional Safeguards
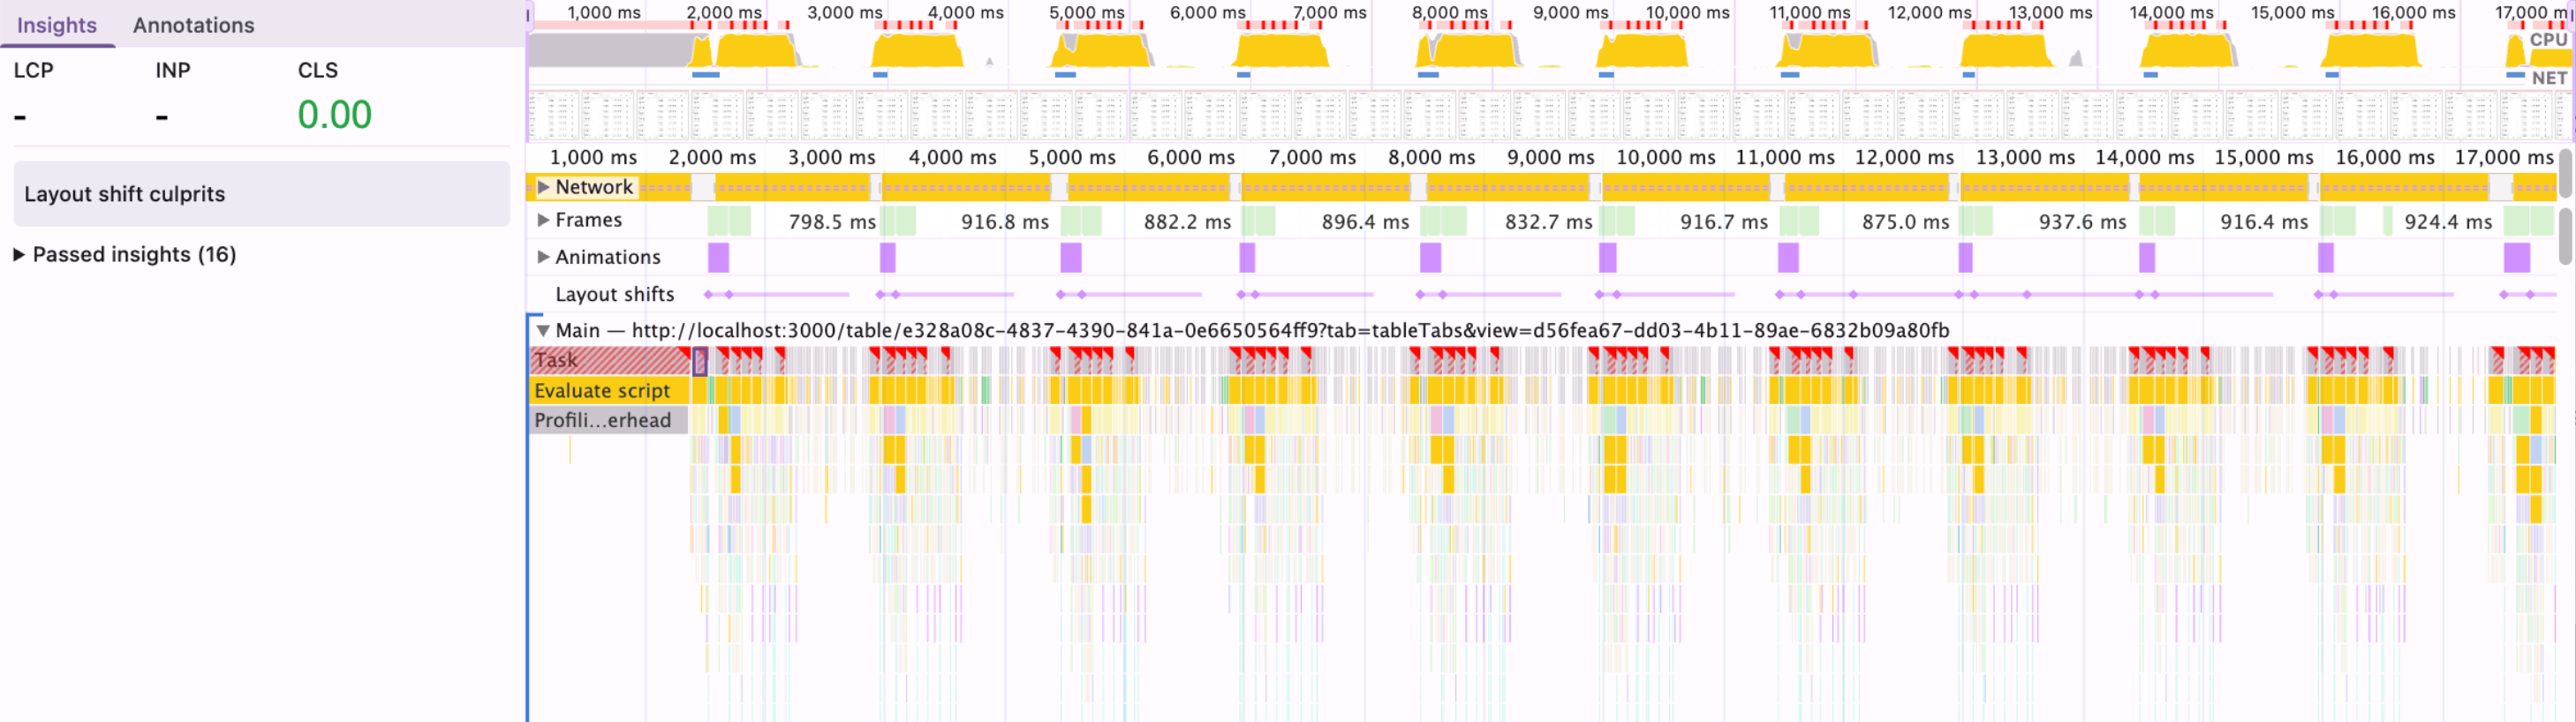
With the two biggest issues resolved, the tables were usable again – even “zippy” as one customer noted! But evidently, there were still pockets of heavy system usage.
While I had the context and was already deep in the code, it felt like the right moment to tackle some remaining low-hanging fruit and safeguards against future scale. More profiling, more BIDEC-ing, and I landed on a few more changes.
The next most impactful step was updating the subscription throttling from 500ms to 1500ms. Our subscription handler throttled refetches to avoid reacting to every single event. At 500ms under the given load, that still meant two full refetches per second. Bumping to 1500ms reduced that by 3x. For an operations team managing fulfillment, 1.5s latency on a new sales order creation is indistinguishable from 0.5s.
Lastly, I set up the startTransition for row data updates. When a subscription-triggered refetch completed, the resulting state update would replace the entire table's row data in one go, an expensive re-render that blocked user interaction. Wrapping it in React’s startTransition made it interruptible, so the browser could pause mid-render to handle a click or keystroke first. A small change, but meaningful for perceived responsiveness and a useful safeguard if update volume increases further.
Takeaways
Debugging under pressure can always be chaotic, but here are some principles outside of BIDEC that made this a success.
Measure before you fix. Without the profiler, I'd have spent days chasing dependency arrays and memoizing things that had nothing to do with the actual problem. It didn't hand me the answers, but it pointed me toward the right questions, helped me trace the excessive re-renders to their root cause, and confirmed that each fix actually resulted in real performance improvements.
Surgical beats comprehensive under pressure. A full refactor of DossTable is probably still needed someday. But under a time crunch with a major customer on the line, the right move was to find the highest-leverage changes and ship them with confidence. Constraints, as frustrating as they are, force a kind of prioritization that can lead to better short-term outcomes.
I'm honestly not sure what I answered to the "slow website" question a year ago, but it’s safe to say that I would have a couple new ideas now!