_image06e.png)
Our CI pipeline at DOSS had gradually become an accepted cost of shipping. It was trustworthy, but slow enough that it had become a meaningful bottleneck on iteration. Pipelines get like this in a very predictable way: a job gets added for a good reason, the reason changes, the job stays. Multiply by three years, with everyone who has the context to fix it busy shipping the product.
Which is why the project went to me. I had joined that week, and as a new hire, I had both the time and the lack of assumptions to examine the pipeline from first principles. So before writing any code, I spent my first day reading every workflow in the repo and timing recent deploy runs step by step, to understand where a production deploy actually spent its time.
For a typical ~25 minute production deploy, the wall time broke down like this:
- Cache restoration: anywhere from 3 to 10 minutes just pulling node_modules and other caches down from GitHub’s cache storage
- Tests: about 10 minutes of unit tests, linting, and typechecking, with the phase dominated by the slowest test shard
- Database migrations: about 2 minutes
- The deploys themselves: about 6 minutes pushing to Cloud Run and Vercel
Migrations and the actual deploys are mostly irreducible. Cache restoration was the clearest anomaly: on a bad day we spent ten minutes downloading files we had uploaded an hour earlier, before a single test ran. Between that and the test phase, around 85% of the wall time was in places we could actually touch. I wrote all of this up as a design doc the same day, with a list of proposed changes ordered by when I found them. The rest of this post is that list, regrouped a bit.
How a deploy works here
A bit of context makes the rest easier to understand. DOSS is a TypeScript monorepo deployed through GitHub Actions. When a commit merges to main, staging runs the test suite, builds Docker images tagged with the commit SHA, runs migrations, and deploys the backend to Cloud Run and the frontend to Vercel.
Production doesn’t rebuild those artifacts. We promote a SHA that has already shipped to staging and been QA’d there, then deploy the exact images that staging used.
That last detail is where the biggest win came from.
The tests production didn’t need
Before May, a typical production deploy looked like this: a commit merged to main, staging ran the full test suite, the passing tests unblocked the image builds, and someone QA’d that exact SHA on staging. Then production took the same SHA and ran the full test suite again.
That meant spending ten-plus minutes testing a commit whose tests had already passed, before deploying an image that already existed and would not be rebuilt either way.
Nobody designed it that way on purpose. The production workflow was originally a copy of the staging one, and copying the test jobs was the safe default. It just never got revisited, and “the tests run before every prod deploy” feels like a safety property until you notice the tests aren’t testing anything new.
The fix is a 68-line change: when a production deploy starts, check whether staging is already green for this exact SHA. If it is, skip the test jobs and go straight to promotion. If it isn’t (say, a hotfix cherry-picked directly to prod that never went through staging), run everything as before. The property we actually care about is that the artifact being deployed has passed tests, and on the fast path that was already true before the workflow even started.
Since shipping it, about 45% of our production deploys have taken the fast path. Those deploys skip the entire test phase, which is why a good chunk of them now finish in under ten minutes.
Stop recomputing old answers
tsc and ESLint both support incremental modes. TypeScript writes a .tsbuildinfo file and ESLint writes a .eslintcache, and both amount to the same idea: a content hash of each file next to the result of checking it. If the hash hasn’t changed, the answer hasn’t changed, skip the file. We were already generating both files across the monorepo. We were also throwing them away at the end of every CI run and starting cold on the next one, because nobody had wired them into the Actions cache. Wiring them in was a 43-line change. Typechecking and linting a commit now costs time proportional to the size of the change.
A couple of weeks later we pushed the same idea one level up with Turborepo. Instead of caching per-file results inside a tool, Turborepo hashes the inputs of an entire task (the source files, the config, the dependencies) and caches its outputs, shared between CI runs and local machines. If nothing a task depends on changed, the task doesn’t run at all. Locally this brought linting plus typechecking a typical changeset down to around 10 seconds total, which mattered more than the CI win: when the pre-push check costs 10 seconds, people stop reaching for --no-verify, and things get caught before CI instead of by it.
The same theme showed up in smaller places once we knew to look for it:
- Deploy workflows ran Jest with --coverage, even though the report was only useful on PRs. Turning it off saved about a minute.
- Our Linear status-update step checked out the entire repository just to inspect the diff. The GitHub Compare API gave us the same information without a checkout, saving another minute.
- Every job hashed, cached, and linted a 7,500-line generated CSS file.
- One shared-code test suite spent 90 seconds starting Docker containers for services it never contacted.
- Kafka tests ran even when none of the changed files could affect them.
None of these was a major optimization on its own. Together they recovered about five minutes of wall time.
Balancing the test shards
Our test suites are sharded: split the files across N parallel jobs and run them simultaneously. Jest’s built-in sharding splits the file list into equal-sized chunks, which works fine until your test files stop being remotely equal in cost. Some run in two seconds, some spin up a database and run for two minutes. Sooner or later one shard catches a clump of the slow ones, and since the phase isn’t done until the slowest shard is done, everyone waits on it. Our worst suite had one shard taking 10 minutes while its three siblings finished in 5 to 6. The job’s wall time was 10 minutes even though the average shard needed about 7.
This is a well-understood scheduling problem with a simple approximate solution: longest-processing-time-first bin packing. Sort jobs by duration, assign each to the emptiest bin. The only thing missing was the durations, so now every successful master run records per-file test timings and caches them, and the next run’s sharding distributes files by historical duration instead of by count. All four shards of that suite now land around 7 minutes, which is three minutes of wall time back without touching a single test.
Run independent work independently
The other scheduling improvement was simpler: find work that had been serialized despite having no dependency.
Staging ran tests and then builds sequentially, even though production already ran the equivalent steps concurrently. Making staging match saved about two minutes, with a bail-out that stops the run if tests fail.
Backend test jobs also pulled Docker images and restored the Yarn cache sequentially. Running those downloads in parallel barely changes wall time, but saves 8 to 12 minutes of billable runner time per run.
Removing the runner bottleneck
Everything so far happened on stock GitHub-hosted runners, and it took a ~25 minute prod deploy to around 20. Two ceilings remained, and both belonged to the runners themselves. Cache restoration was still eating minutes because GitHub’s cache storage sits far from its runners over a relatively constrained connection. And the CPUs are unremarkable, which taxes everything from compiles to Docker builds.
So we moved to Depot’s runners. They’re a drop-in replacement for GitHub-hosted runners, so the migration diff is essentially changing the runs-on line in each workflow. That’s also the rollback plan, which is what made me comfortable moving fast.
The difference was immediate. Cache restores that took 3 to 10 minutes on GitHub’s runners take seconds on Depot’s, because their cache lives right next to their runners over much higher-bandwidth local infrastructure. The faster CPUs also reduced the runtime of nearly every compute-bound step. The pricing compounds with the speed: Depot charges about half GitHub’s per-minute rate for the equivalent runner, and the runs themselves became shorter. A staging deploy fell from roughly $3.50–$4.00 in runner time to about $1.50. Not sponsored. It has just been good.
Faster tools
We also replaced some of the slowest parts of the toolchain:
- Typechecking moved from tsc to tsgo, cutting typecheck time by roughly 3x.
- Jest 30 took our API suite from about four minutes to about two.
- Prettier moved to oxfmt, mostly improving local developer experience but also reducing CI time.
tsgo required updating a few unsupported tsconfig options and surfaced some real errors that tsc had missed, but the migration was otherwise straightforward.
Results
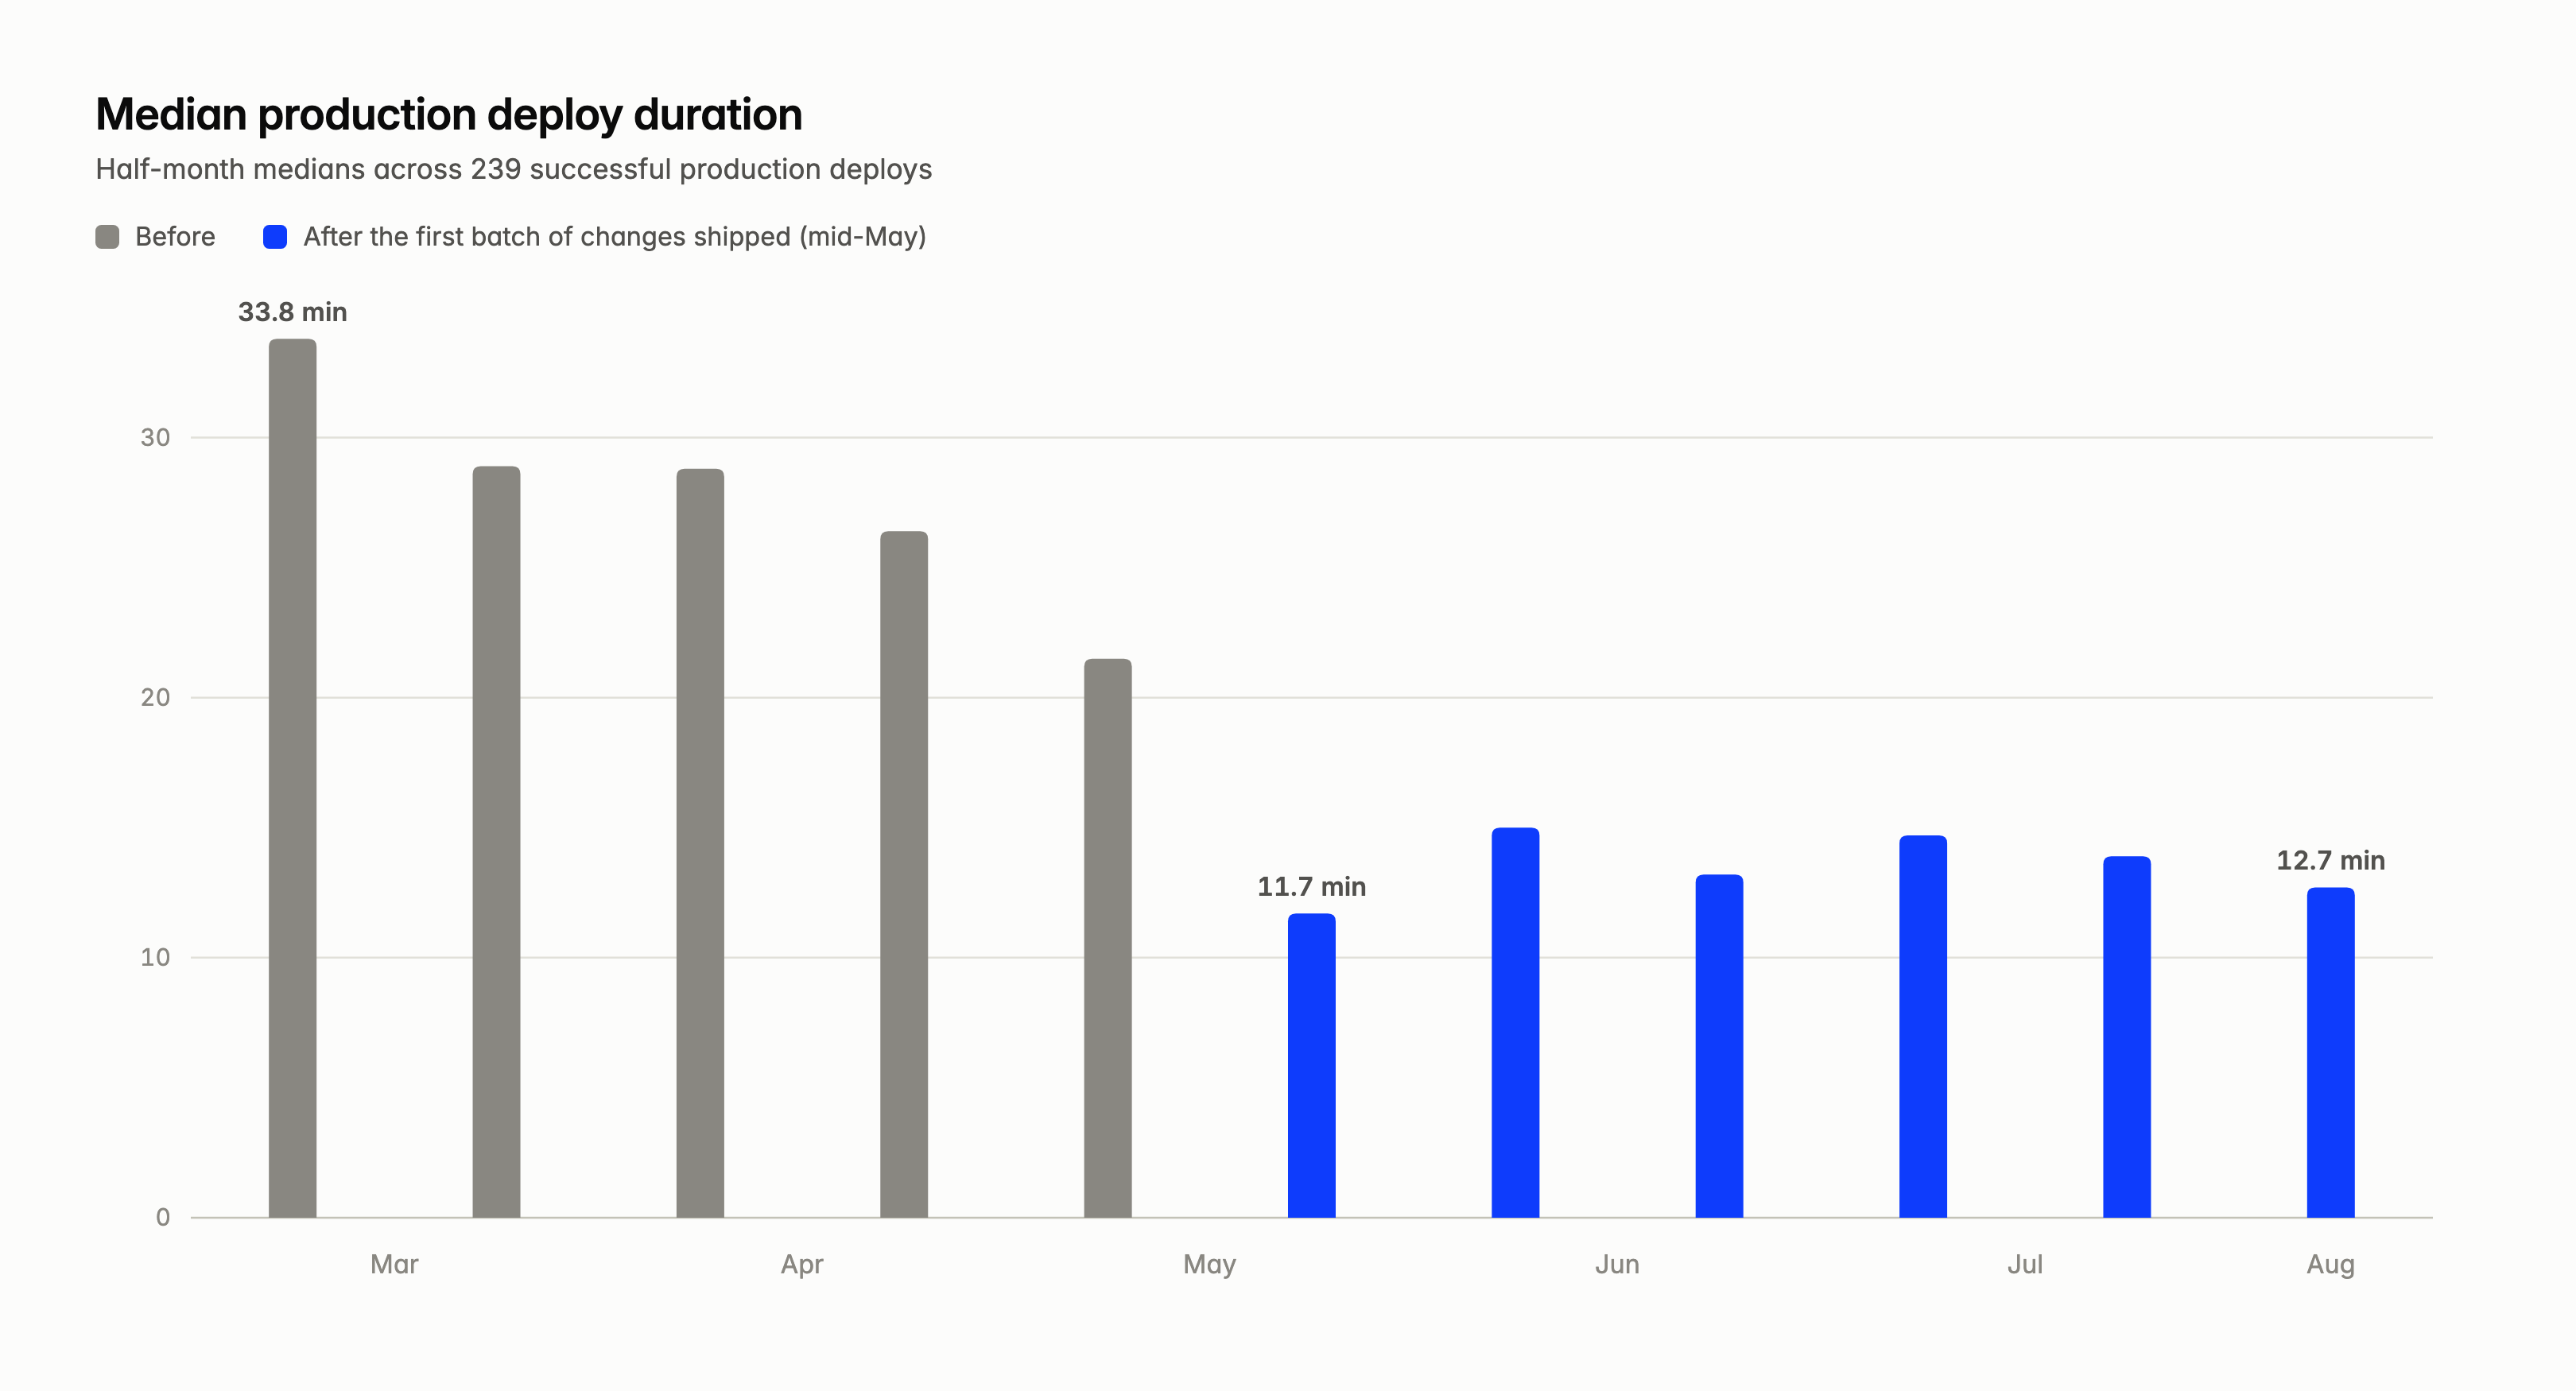
The median production deploy from March through early May was 28.7 minutes across 111 successful runs. In June and July it was about 14, a 51% cut, and the cliff in the chart lands exactly in the half-month the first batch of changes merged. Staging went from roughly 30 minutes to 13. Nothing about the test suite got smaller, and the repo kept growing the whole time.
Most of the improvement came not from doing the same work faster, but from identifying work that did not need to happen at all.
What’s next
There is still more to do. Moving to oxlint could make linting substantially faster, but first requires consolidating the different ESLint versions and configurations across the monorepo. A pnpm migration and more aggressive use of Depot’s local cache are also on the backlog.
CI performance is not a one-time project. The repository and test suite keep growing, and latency gradually returns unless we keep measuring it. For now, a merge reaches production in about 14 minutes.
If you like making things fast, we’re hiring .