
Most consumer goods brands do not have a demand planning problem. They have a data problem wearing a demand planning costume. The forecast lives in a spreadsheet that someone updates monthly, sales data arrives from three channels in three formats, and by the time the numbers are reconciled, the purchasing decision they were supposed to inform has already been made on gut feel.
The cost shows up on both sides of the ledger. Forecast too low and you get stockouts , lost velocity at retail, and expensive air freight to catch up. Forecast too high and cash sits in a warehouse as dead inventory, which for food and beverage brands eventually becomes literal waste. Demand planning best practices exist to shrink both failure modes at once, and none of them require a data science team.
This guide covers seven demand planning best practices that consumer goods operators can actually run, plus the operational foundation that makes them stick.
Start With Clean, Unified Demand Data
A forecast is only as good as the demand signal feeding it. For most consumer brands, that signal is fragmented: Shopify shows DTC orders, EDI feeds show retail POs, a wholesale portal shows B2B, and the 3PL shows what actually shipped. If those never land in one place, every planning meeting starts with an argument about whose number is right.
The first best practice is unglamorous: consolidate sales, inventory, and open order data into a single source of truth before you tune a single forecast model. That means capturing demand at the SKU level, by channel, by week, with returns and promotions flagged. Brands that skip this step end up with sophisticated forecasts built on numbers nobody trusts.
Clean data also means recording true demand, not just sales. If a product stocked out for three weeks, sales during that window understate what customers wanted. Mark those periods so the history you plan from reflects demand, not supply failures.
Forecast at the Level Where Decisions Happen
Aggregate forecasts flatter your accuracy and hide your problems. A brand can be 95 percent accurate at the total-revenue level while being wildly wrong on individual SKUs, and purchasing happens at the SKU level.
Plan at the level where you place purchase orders: SKU by location for replenishment, SKU by channel where demand patterns differ. A sparkling water brand may see steady grocery velocity but spiky DTC demand driven by promotions. One blended forecast serves neither. Roll detail up for finance reviews, but never plan top-down only.
Then measure accuracy honestly. Track forecast versus actual at the SKU level every cycle, and focus attention on the 20 percent of SKUs that drive 80 percent of revenue. Chasing precision on the tail is effort the top movers deserve. For everything else, simple statistical baselines with wide safety stock buffers are usually the right trade.
Segment Your Catalog So Effort Matches Stakes
Not every SKU deserves the same planning attention, and pretending otherwise burns the hours that matter. The standard tool is ABC segmentation: A items are the top sellers that drive most of your revenue, B items are the steady middle, and C items are the long tail. A typical consumer goods catalog puts 15 to 20 percent of SKUs in the A tier and finds they account for 70 to 80 percent of revenue.
Each tier gets a different planning policy. A items get reviewed weekly, forecast with judgment layered on the statistical baseline, and protected with service-level targets of 98 percent or higher, because a stockout on a hero SKU costs shelf placement and customer trust. B items run on statistical forecasts with monthly review. C items get simple min-max rules and a quarterly look, plus a standing question: should this SKU exist at all? Long tails accumulate quietly, and every marginal SKU adds forecast error, safety stock, and warehouse slots.
Segmentation also sharpens the discontinuation decision. When a C item's forecast error stays high and its margin contribution stays low for two consecutive quarters, the best demand plan is often no demand at all. Bootstrapped and lean teams especially cannot afford to plan four hundred SKUs with equal rigor, and the discipline of tiering is what makes the rest of these practices sustainable.
Plan Collaboratively, Decide on Cadence
The best demand signal in a consumer goods company usually is not in the data yet. Sales knows a retailer is resetting shelves in October. Marketing knows a promotion is landing in two weeks. The founder knows a buyer conversation went well. If planning happens in a purchasing silo, all of that surfaces after the PO is cut.
Run a monthly planning cadence that pulls sales, marketing, operations, and finance into one review of the same numbers, a lightweight version of the S&OP process larger companies formalize. The agenda is fixed: forecast versus actual last cycle, changes to upcoming demand (promotions, distribution gains, seasonality), and the supply decisions those changes force. Keep it to an hour by preparing the numbers in advance rather than assembling them live.
Between meetings, define who owns the forecast and who can override it. Overrides should be recorded with a reason. When you review accuracy later, you learn whether human adjustments beat the baseline, and by how much. In many brands, they do for promotions and new items, and they do not for steady replenishment SKUs. Knowing which is which tells you where judgment earns its keep.
Build Seasonality and Promotions Into the Plan
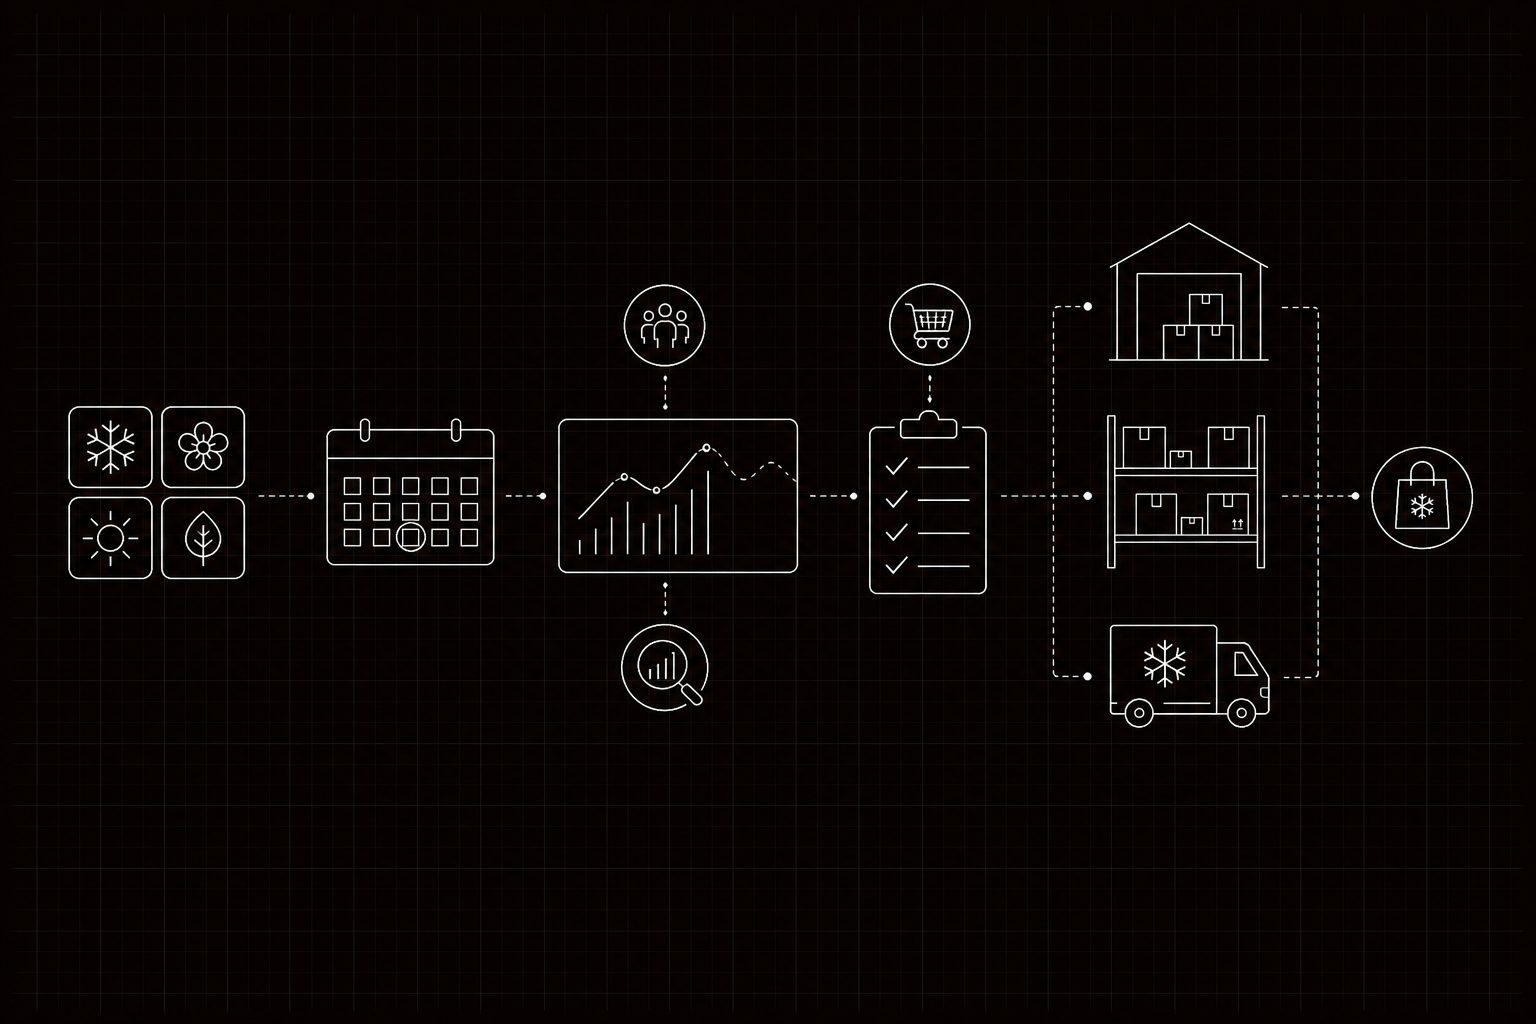
Consumer demand is not smooth, and pretending otherwise is the most common planning failure. Holiday gifting, back-to-school, summer hydration, Q4 retail resets: every consumer category has a shape, and that shape interacts with lead times . If your co-packer needs 90 days and your peak starts in November, your real planning deadline is August.
Two practices keep seasonality from becoming an annual emergency. First, plan peak seasons as their own mini-cycles, working backward from the demand window through production, transit, and receiving. Second, separate baseline demand from event-driven lift in your history. A spike from last year's BOGO is not organic growth, and treating it as baseline inflates this year's buy.
For new products with no history, borrow the curve from the closest analog SKU and adjust for distribution. Then re-forecast aggressively in the first eight weeks as real sell-through arrives. Early actuals beat any launch model.
Connect the Forecast to Replenishment Math
A forecast that does not change what you buy is a report, not a plan. The output of demand planning should flow directly into reorder points , safety stock levels, and purchase order quantities, and those parameters should update as the forecast moves.
This is where static spreadsheets quietly fail. Reorder points calculated during January demand are wrong by June, and nobody recalculates 400 SKUs by hand. The practice that separates disciplined operators is treating safety stock and reorder points as living numbers, recalculated on a schedule from current forecast error and current lead times, not set-and-forget constants.
Watch supplier lead time as closely as demand. Lead times drift, and a two-week slip on a key component quietly invalidates every reorder point built on the old number. Track actual receipt dates against promised dates, and feed the real distribution back into your buffers.
Give the Plan an Operational Home
Demand planning best practices fail in most consumer brands for a mundane reason: the plan lives in a spreadsheet disconnected from the systems that execute it. The forecast says one thing, the inventory system says another, and purchasing splits the difference from memory.
This is the problem DOSS Operations Cloud was built for. DOSS unifies sales orders, inventory, and procurement on one data model, so the demand signal that feeds your forecast is the same data that drives replenishment. Operators see sell-through, stock cover, and open POs in one place, set reorder logic that recalculates as conditions change, and let Dossbot, the embedded AI copilot, handle bulk updates across hundreds of SKUs through chat. Because the platform is composable, planning workflows match how your business actually buys, whether that is weekly co-packer runs or container-level import orders, and changing the workflow takes minutes, not a consulting engagement.
The results are concrete. Mezcla saved 12+ hours per week and doubled PO processing speed after moving operations onto DOSS. Verve cut unbatched orders from 30 percent to 1 percent and saved 20+ hours weekly across the team, hours that now go into planning instead of reconciling.
The Bottom Line
Demand planning is not a forecasting contest. It is an operating discipline: clean demand data, forecasts at the decision level, a cross-functional cadence, honest seasonality, and replenishment math that updates itself. Brands that run these practices carry less inventory, stock out less often, and make purchasing decisions with confidence instead of anxiety.
The foundation is unified data, and that is a systems choice. DOSS Operations Cloud connects inventory, orders, and procurement in one adaptive platform, integrates with the tools you already run, and goes live in months, not years. If your planning process still starts with exporting CSVs, talk to the DOSS team and see what a forecast built on one source of truth looks like.