Rising costs, supply chain volatility, and tougher retail expectations have made consumer packaged goods (CPG) operations harder to run with patchwork systems and manual workarounds. To understand where teams were actually getting stuck, DOSS surveyed 230 U.S.-based operations, supply chain, and manufacturing leaders at CPG and physical goods companies in 2026.
The research focused on workflows across product development, manufacturing, inventory, and retail readiness, along with the tools, handoffs, and process gaps behind the biggest slowdowns. What came through was clear: Many teams were still operating reactively, with delays, bad data, and manual work creating avoidable costs.
Key Takeaways
- 1 in 4 CPG product launches ran behind schedule in the past 12 months.
- 1 in 2 CPG ops leaders shipped product with incorrect labeling, packaging, or documentation due to version confusion or miscommunication in the past year.
- More than 1 in 3 CPG ops leaders (36%) made a significant business decision based on data that later turned out to be outdated or incorrect in the past 12 months.
- CPG ops teams waste 7.5 days per month on tasks they say could be automated.
- 44% of CPG ops teams describe their operations posture as primarily reactive.
- 42% of CPG ops teams are increasing their ops tech budget in 2026, with an average planned increase of 16%.
When One Thing Slips, Everything Slips
Launch problems rarely stay in one lane. Once timing slips, the impact spreads quickly to freight, production, inventory, and retail readiness.
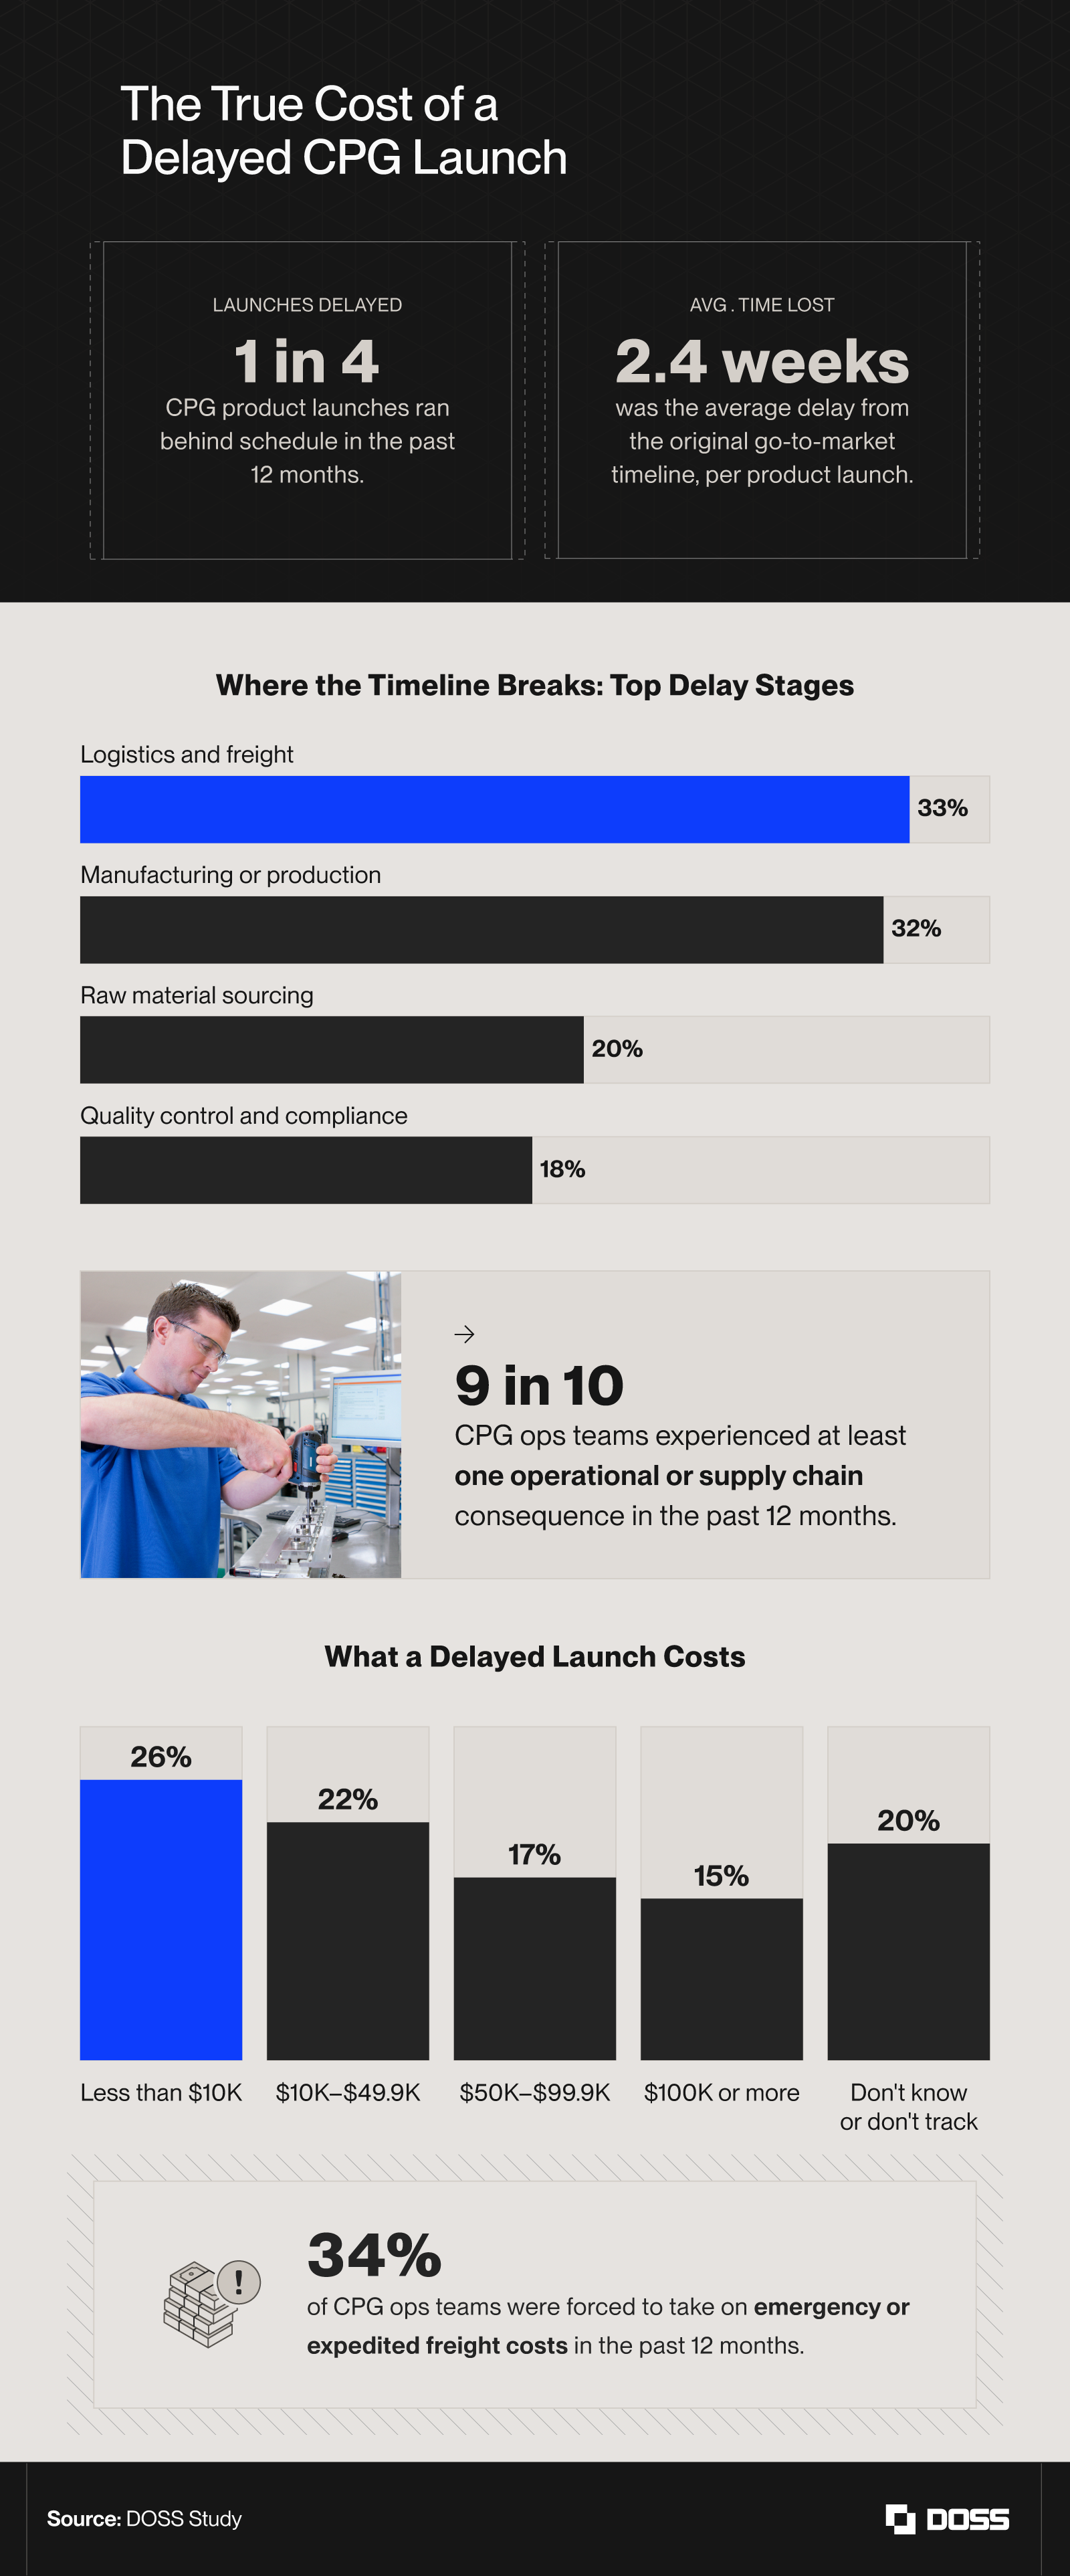
A quarter of CPG product launches ran behind schedule in the past 12 months, and each delayed launch cost an average of 2.4 weeks relative to the original go-to-market timeline. The biggest delay stages were:
- Logistics and freight (33%)
- Manufacturing or production (32%)
- Raw material sourcing (20%)
- Quality control and compliance (18%)
The drag did not stop there. Packaging and labeling errors affected 13% of teams, while supplier onboarding failures hit 12%, showing that smaller workflow failures still disrupted launch prep for roughly 1 in 8 CPG ops teams.
The downstream consequences were expensive and visible. Nine in 10 CPG ops teams experienced at least one operational or supply chain consequence in the past year, including:
- Canceled launches (25%)
- Missed major retail windows (25%)
- Stockouts at retail (22%)
- Excess inventory sold at a discount (19%)
- Lost retail accounts or distribution partnerships (16%)
Costs piled up in multiple ways. Among respondents:
- 26% said a delayed launch cost less than $10,000.
- 22% put the cost at $10,000 to $49,900.
- 17% said $50,000 to $99,900.
- 11% reported costs of $100,000 or more.
A full 20% said they did not know or did not track the cost. Another 34% said they were forced to take on emergency or expedited freight costs in the past 12 months, tying launch delays directly to margin pressure.
Too Many Tools, Not Enough Truth
A lot of operational friction came from basic control issues. When teams had to manage fast-changing information across multiple systems, bad data and manual fixes became part of the workflow.
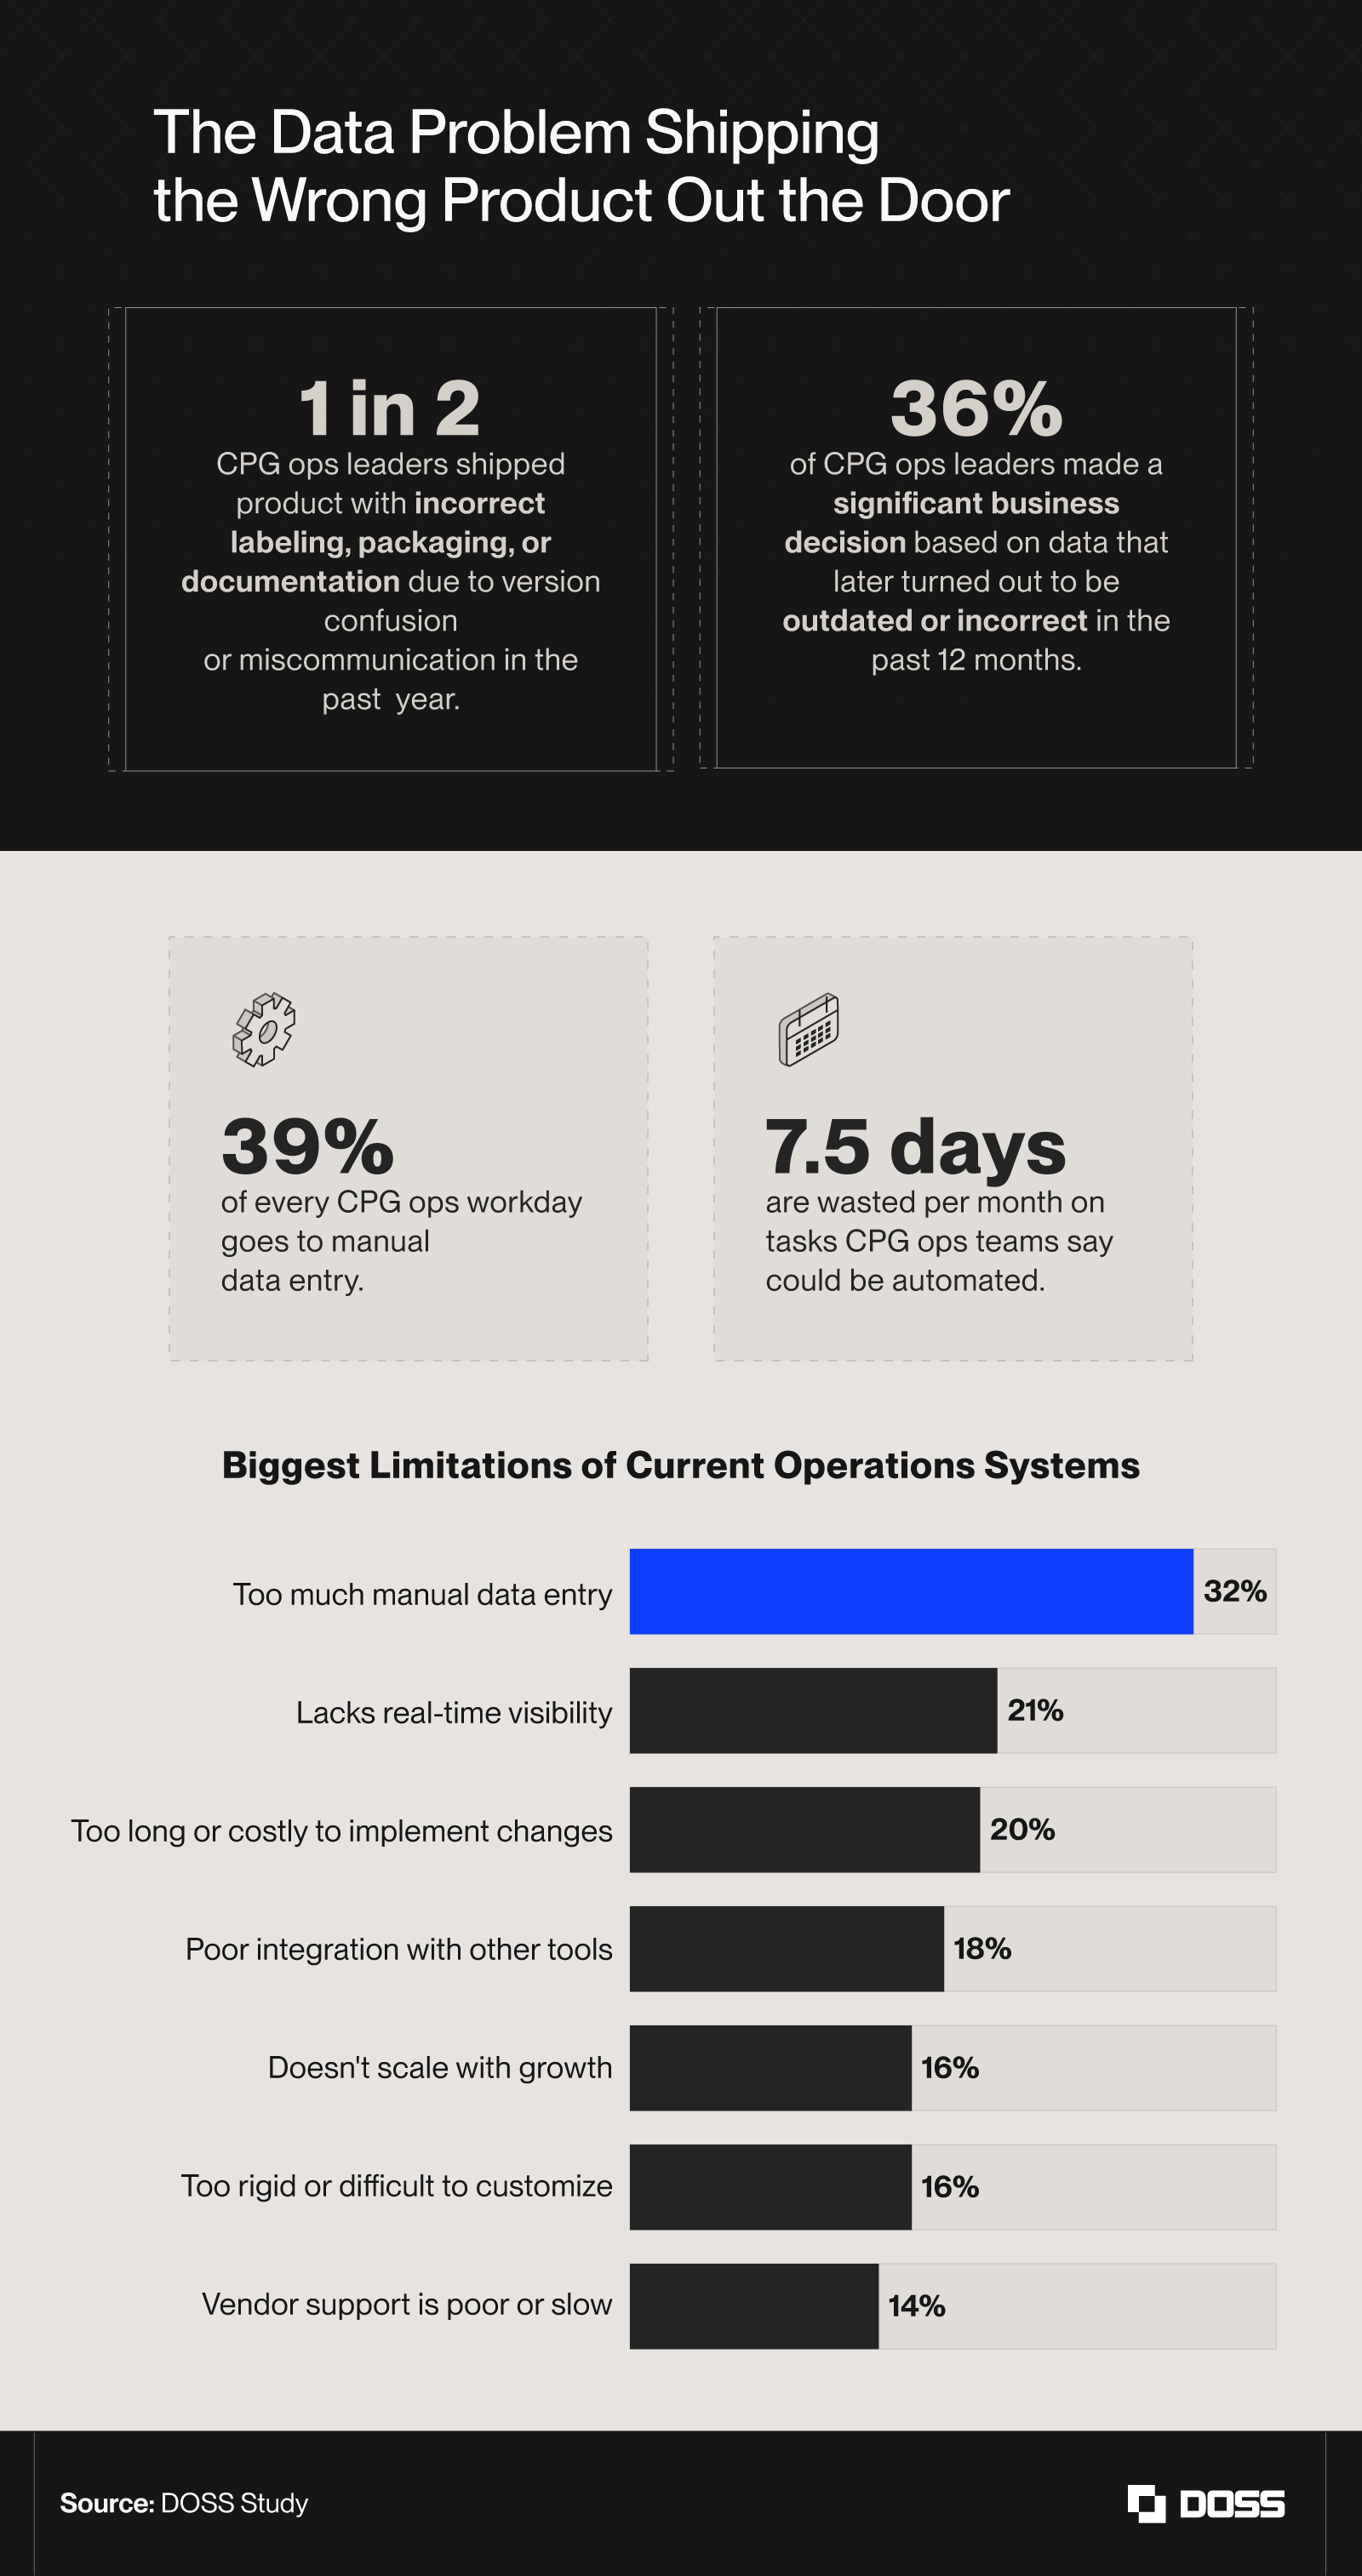
Half of CPG ops leaders said they shipped product with incorrect labeling, packaging, or documentation due to version confusion or miscommunication in the past year. Another 36% said they made a significant business decision based on data that later proved outdated or incorrect. Those were not isolated misses. They pointed to deeper problems with the source of truth in day-to-day operations.
The silos driving that friction were spread across the supply chain. The most frequently cited gaps were between:
- CPG systems and retailer/distribution partner systems (21%)
- Operations and sales/marketing teams (20%)
- Operations and product/R&D teams (17%)
Another 16% said the biggest friction was between their own internal tools and platforms, meaning even teams that weren't dealing with external partners were still fighting their own stack.
It's not hard to see why. The average CPG ops team juggles 4 different tools to manage a single product launch end-to-end, and 29% still rely on spreadsheets as their primary workflow management tool. That's nearly as many as those using a dedicated ERP (31%). More tools, more handoffs, more places for data to go stale or get lost.
Manual work sat underneath a lot of that risk. Respondents said 39% of the average CPG ops workday was spent on manual data entry, while teams wasted 7.5 days per month on tasks they believed could be automated.
When leaders were asked about the biggest limitations of their current operations systems, too much manual data entry ranked first at 32%, followed by:
- Lack of real-time visibility (21%)
- Changes that took too long/cost too much to implement (20%)
- Poor integration with other tools (18%)
- Systems that did not scale with growth (16%)
- Rigid or hard-to-customize platforms (16%)
- Slow or poor vendor support (14%)
AI hasn't quite closed that gap yet. Forty percent of CPG ops leaders were already using AI tools, and another 22% were evaluating them. But only 14% of users said AI had meaningfully improved their efficiency.
Reactive Is the Default, but It Doesn't Have to Be
The strongest teams were not just moving faster. They had tighter communication, clearer documentation, and better operating discipline, which made it easier to handle volatility without constant firefighting.
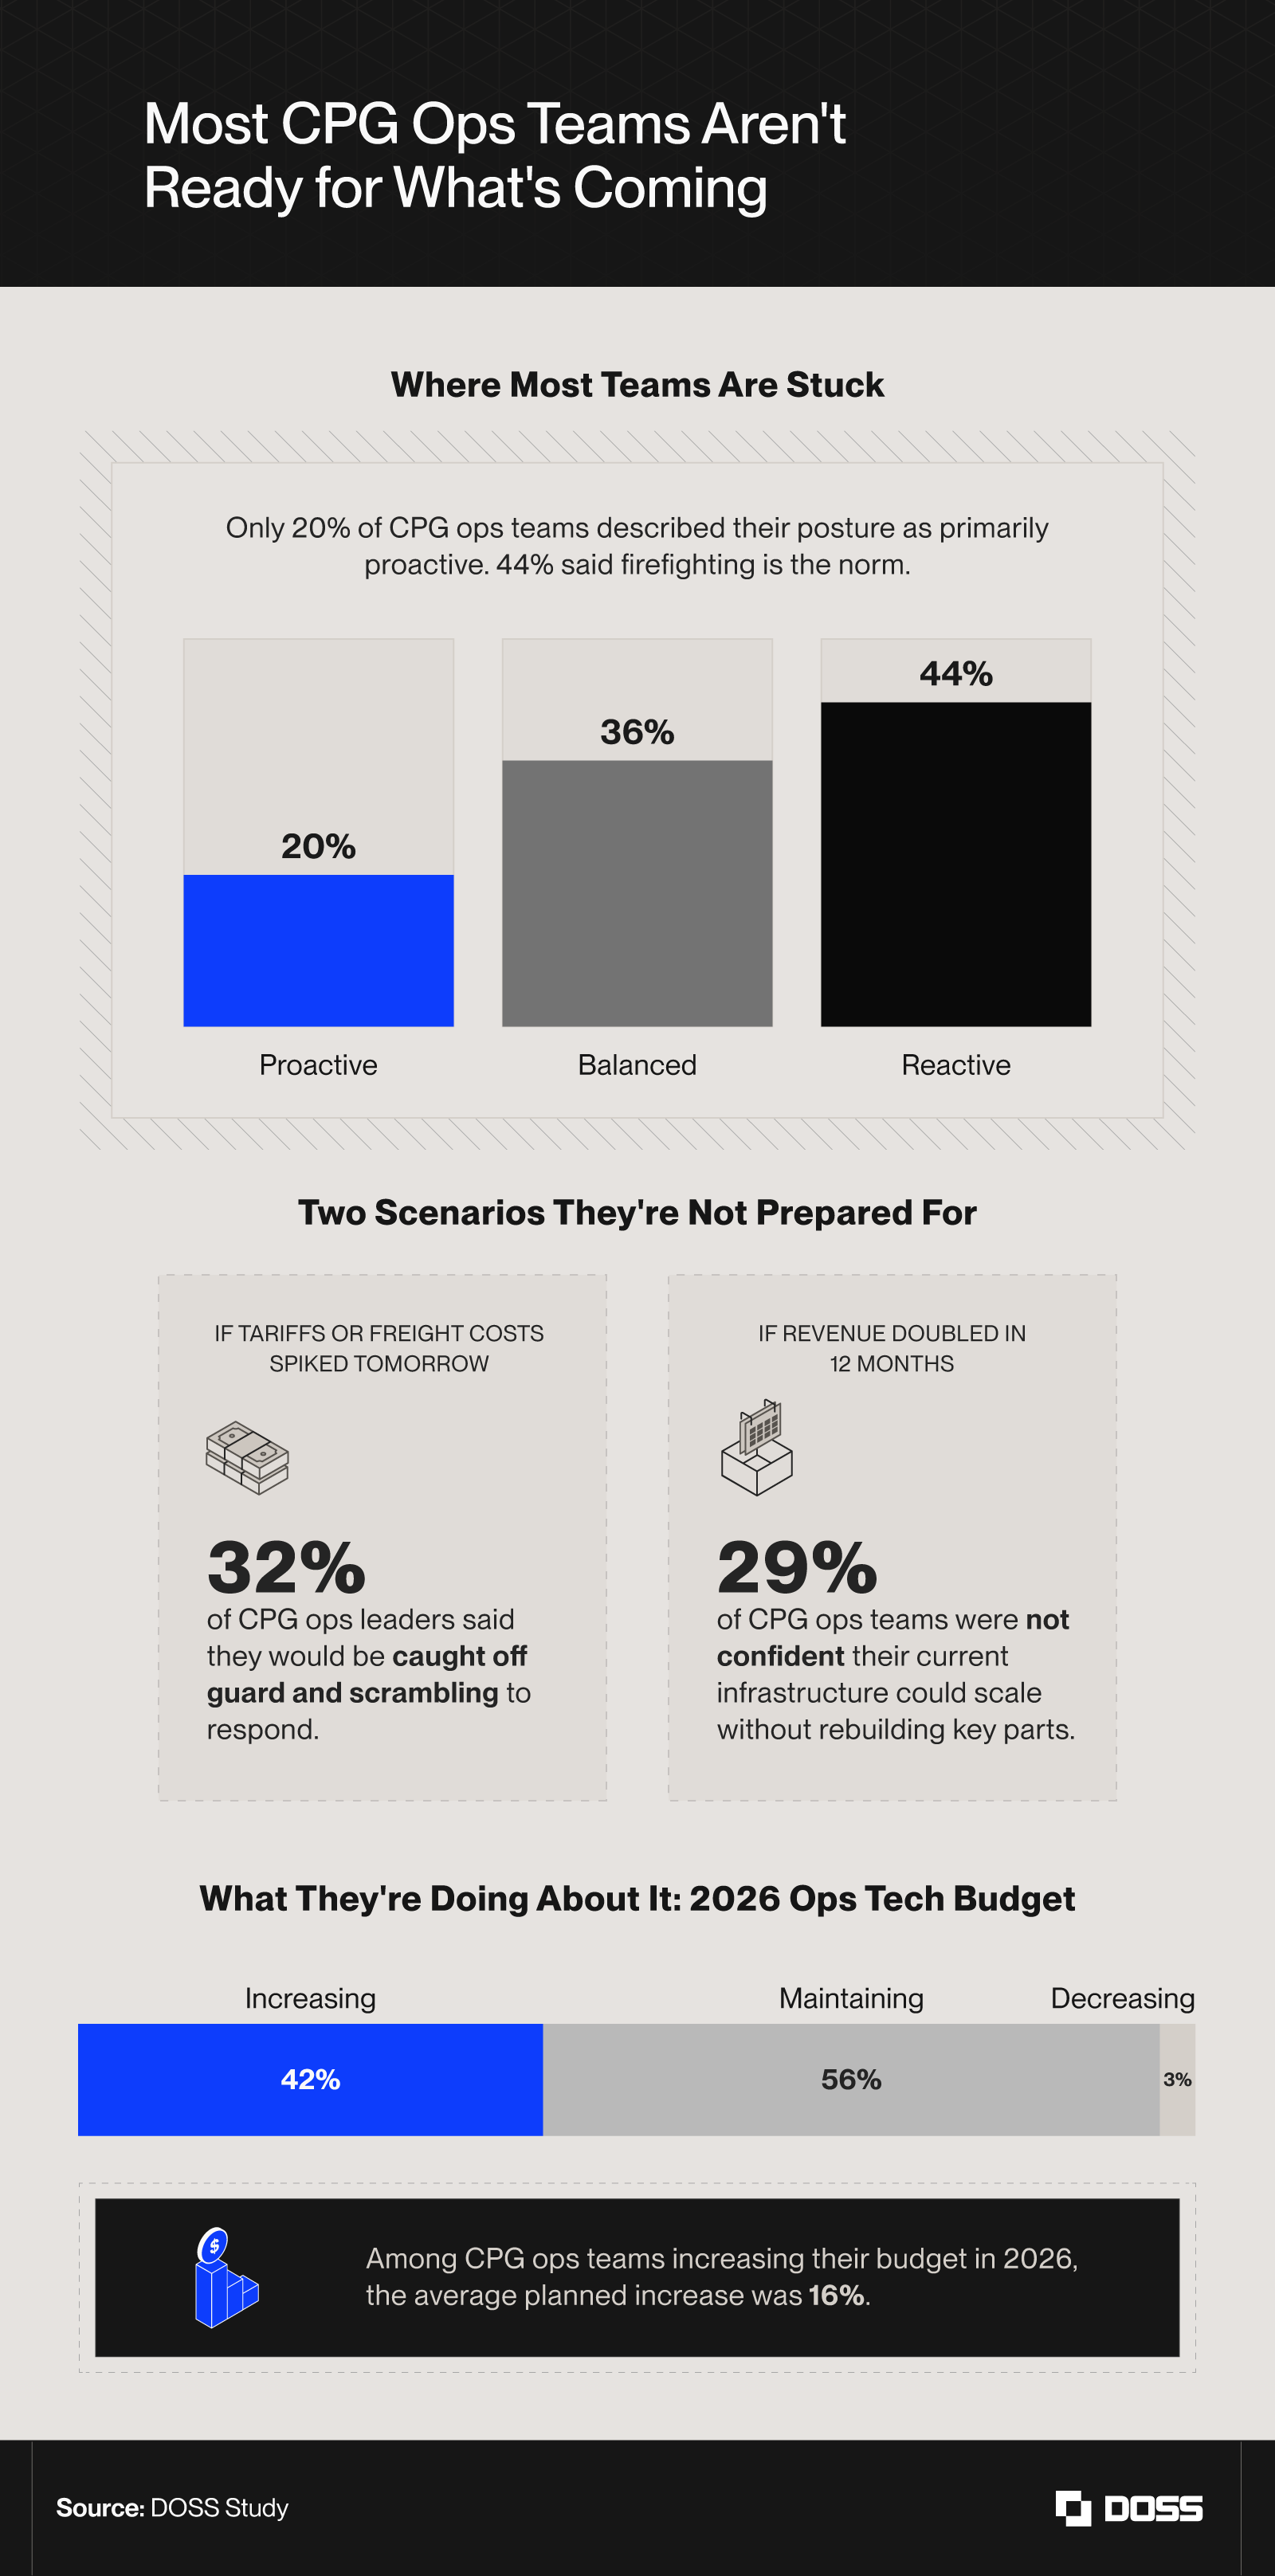
Nearly half of CPG ops teams (44%) defined their operations as reactive. Another 36% said they were balanced, while only 20% said they were primarily proactive. That left a lot of teams exposed when conditions changed quickly.
The structural reasons weren't hard to find. Only 43% of teams had documented SOPs covering most core workflows, while 36% had partial coverage and 21% were using outdated or nonexistent documentation. Cross-functional misalignment made things worse: 38% of CPG ops leaders said it affected at least half of their product launches, while only 16% said it rarely or never caused a slowdown.
That fragility showed up when teams were asked about forward-looking scenarios. Nearly a third (32%) said they'd be caught off guard and scrambling if tariffs or freight costs spiked tomorrow, and 29% weren't confident their infrastructure could scale if revenue doubled over the next 12 months.
The teams making the most progress on operational efficiency in the past year most often focused on:
- Improving cross-functional communication (17%)
- Automation or AI adoption (13%)
- SOP standardization (13%)
- ERP upgrades (11%)
Investment is moving in the right direction. Overall, 42% of teams are increasing their ops tech budget in 2026, with an average planned increase of 16%. Most of the rest plan to hold steady. The question is whether that spend goes toward tools that actually reduce the coordination and documentation gaps driving reactive behavior in the first place.
Methodology
We surveyed 230 operations, supply chain, and manufacturing leaders working for U.S.-based consumer packaged goods (CPG) or physical goods companies in 2026. The average respondent age was 37; 48% held manager-level titles, 41% were individual contributors or specialists, and 11% held director-level or above roles (including directors, owners, founders, C-suite, and VPs). Generationally, 18% were baby boomers and Gen X combined, 53% were millennials, and 29% were Gen Z. Respondents spanned a range of company revenue tiers, product categories, and sales channels, including retail (35%), direct-to-consumer (30%), omnichannel (20%), online marketplace (10%), foodservice or hospitality (3%), and other (3%).
About DOSS
DOSS is the Operations Cloud built for the real world: a modern, AI-native platform that helps product-based businesses manage the flow of goods, dollars, and data across procurement, inventory, orders, fulfillment, and finance in real time. With composable modules and a unified master data model, DOSS helps operations teams adapt faster to volatility and make confident decisions when costs shift unexpectedly. Learn more at www.doss.com .
Fair Use Statement
The data and findings in this article may be used for noncommercial purposes only. When sharing or republishing, please include a link with proper attribution to DOSS.
-p-1600_image62f.png)
_imagefdd.png)